'%3e%3crect%20x='2'%20y='1.64014'%20width='48'%20height='48'%20rx='24'%20fill='%23292929'/%3e%3crect%20x='2.625'%20y='2.26514'%20width='46.75'%20height='46.75'%20rx='23.375'%20stroke='%23636363'%20stroke-width='1.25'/%3e%3cpath%20d='M22.6665%2025.6402L24.8887%2027.8624L29.8887%2022.8624M20.8151%2016.5498C21.7082%2016.4786%2022.5561%2016.1273%2023.2381%2015.5462C24.8295%2014.19%2027.1701%2014.19%2028.7615%2015.5462C29.4434%2016.1273%2030.2913%2016.4786%2031.1845%2016.5498C33.2687%2016.7162%2034.9238%2018.3712%2035.0901%2020.4555C35.1614%2021.3486%2035.5126%2022.1965%2036.0938%2022.8785C37.4499%2024.4699%2037.4499%2026.8105%2036.0938%2028.4019C35.5126%2029.0838%2035.1614%2029.9317%2035.0901%2030.8249C34.9238%2032.9091%2033.2687%2034.5642%2031.1845%2034.7305C30.2913%2034.8018%2029.4434%2035.153%2028.7615%2035.7341C27.1701%2037.0903%2024.8295%2037.0903%2023.2381%2035.7341C22.5561%2035.153%2021.7082%2034.8018%2020.8151%2034.7305C18.7308%2034.5642%2017.0758%2032.9091%2016.9094%2030.8249C16.8382%2029.9317%2016.487%2029.0838%2015.9058%2028.4019C14.5496%2026.8105%2014.5496%2024.4699%2015.9058%2022.8785C16.487%2022.1965%2016.8382%2021.3486%2016.9094%2020.4555C17.0758%2018.3712%2018.7308%2016.7161%2020.8151%2016.5498Z'%20stroke='%23E7E7E7'%20stroke-width='1.125'%20stroke-linecap='round'%20stroke-linejoin='round'/%3e%3c/g%3e%3cdefs%3e%3cfilter%20id='filter0_d_411_10857'%20x='0.5'%20y='0.140137'%20width='51'%20height='51'%20filterUnits='userSpaceOnUse'%20color-interpolation-filters='sRGB'%3e%3cfeFlood%20flood-opacity='0'%20result='BackgroundImageFix'/%3e%3cfeColorMatrix%20in='SourceAlpha'%20type='matrix'%20values='0%200%200%200%200%200%200%200%200%200%200%200%200%200%200%200%200%200%20127%200'%20result='hardAlpha'/%3e%3cfeMorphology%20radius='1.5'%20operator='dilate'%20in='SourceAlpha'%20result='effect1_dropShadow_411_10857'/%3e%3cfeOffset/%3e%3cfeComposite%20in2='hardAlpha'%20operator='out'/%3e%3cfeColorMatrix%20type='matrix'%20values='0%200%200%200%200.08%200%200%200%200%200.08%200%200%200%200%200.08%200%200%200%201%200'/%3e%3cfeBlend%20mode='normal'%20in2='BackgroundImageFix'%20result='effect1_dropShadow_411_10857'/%3e%3cfeBlend%20mode='normal'%20in='SourceGraphic'%20in2='effect1_dropShadow_411_10857'%20result='shape'/%3e%3c/filter%3e%3c/defs%3e%3c/svg%3e)
'%3e%3crect%20x='2'%20y='1.64014'%20width='48'%20height='48'%20rx='24'%20fill='%23292929'/%3e%3crect%20x='2.625'%20y='2.26514'%20width='46.75'%20height='46.75'%20rx='23.375'%20stroke='%23636363'%20stroke-width='1.25'/%3e%3cpath%20d='M21.5556%2015.6401H19.5556C18.311%2015.6401%2017.6887%2015.6401%2017.2134%2015.8823C16.7952%2016.0954%2016.4553%2016.4354%2016.2422%2016.8535C16%2017.3289%2016%2017.9511%2016%2019.1957V21.1957M21.5556%2035.6401H19.5556C18.311%2035.6401%2017.6887%2035.6401%2017.2134%2035.3979C16.7952%2035.1849%2016.4553%2034.8449%2016.2422%2034.4268C16%2033.9514%2016%2033.3291%2016%2032.0846V30.0846M36%2021.1957V19.1957C36%2017.9511%2036%2017.3289%2035.7578%2016.8535C35.5447%2016.4354%2035.2048%2016.0954%2034.7866%2015.8823C34.3113%2015.6401%2033.689%2015.6401%2032.4444%2015.6401H30.4444M36%2030.0846V32.0846C36%2033.3291%2036%2033.9514%2035.7578%2034.4268C35.5447%2034.8449%2035.2048%2035.1849%2034.7866%2035.3979C34.3113%2035.6401%2033.689%2035.6401%2032.4444%2035.6401H30.4444M30.4444%2025.6401C30.4444%2028.0947%2028.4546%2030.0846%2026%2030.0846C23.5454%2030.0846%2021.5556%2028.0947%2021.5556%2025.6401C21.5556%2023.1855%2023.5454%2021.1957%2026%2021.1957C28.4546%2021.1957%2030.4444%2023.1855%2030.4444%2025.6401Z'%20stroke='%23E7E7E7'%20stroke-width='1.125'%20stroke-linecap='round'%20stroke-linejoin='round'/%3e%3c/g%3e%3cdefs%3e%3cfilter%20id='filter0_d_1154_2040'%20x='0.5'%20y='0.140137'%20width='51'%20height='51'%20filterUnits='userSpaceOnUse'%20color-interpolation-filters='sRGB'%3e%3cfeFlood%20flood-opacity='0'%20result='BackgroundImageFix'/%3e%3cfeColorMatrix%20in='SourceAlpha'%20type='matrix'%20values='0%200%200%200%200%200%200%200%200%200%200%200%200%200%200%200%200%200%20127%200'%20result='hardAlpha'/%3e%3cfeMorphology%20radius='1.5'%20operator='dilate'%20in='SourceAlpha'%20result='effect1_dropShadow_1154_2040'/%3e%3cfeOffset/%3e%3cfeComposite%20in2='hardAlpha'%20operator='out'/%3e%3cfeColorMatrix%20type='matrix'%20values='0%200%200%200%200.08%200%200%200%200%200.08%200%200%200%200%200.08%200%200%200%201%200'/%3e%3cfeBlend%20mode='normal'%20in2='BackgroundImageFix'%20result='effect1_dropShadow_1154_2040'/%3e%3cfeBlend%20mode='normal'%20in='SourceGraphic'%20in2='effect1_dropShadow_1154_2040'%20result='shape'/%3e%3c/filter%3e%3c/defs%3e%3c/svg%3e)
'%3e%3crect%20x='2'%20y='1.64014'%20width='48'%20height='48'%20rx='24'%20fill='%23292929'/%3e%3crect%20x='2.625'%20y='2.26514'%20width='46.75'%20height='46.75'%20rx='23.375'%20stroke='%23636363'%20stroke-width='1.25'/%3e%3cpath%20d='M23.7778%2031.9275V34.5291C23.7778%2035.7564%2024.7727%2036.7513%2026%2036.7513C27.2273%2036.7513%2028.2222%2035.7564%2028.2222%2034.5291V31.9275M26%2014.5291V15.6402M16%2025.6402H14.8889M18.7778%2018.4179L18.111%2017.7512M33.2222%2018.4179L33.8892%2017.7512M37.1111%2025.6402H36M32.6667%2025.6402C32.6667%2029.3221%2029.6819%2032.3068%2026%2032.3068C22.3181%2032.3068%2019.3333%2029.3221%2019.3333%2025.6402C19.3333%2021.9583%2022.3181%2018.9735%2026%2018.9735C29.6819%2018.9735%2032.6667%2021.9583%2032.6667%2025.6402Z'%20stroke='%23E7E7E7'%20stroke-width='1.125'%20stroke-linecap='round'%20stroke-linejoin='round'/%3e%3c/g%3e%3cdefs%3e%3cfilter%20id='filter0_d_1117_17437'%20x='0.5'%20y='0.140137'%20width='51'%20height='51'%20filterUnits='userSpaceOnUse'%20color-interpolation-filters='sRGB'%3e%3cfeFlood%20flood-opacity='0'%20result='BackgroundImageFix'/%3e%3cfeColorMatrix%20in='SourceAlpha'%20type='matrix'%20values='0%200%200%200%200%200%200%200%200%200%200%200%200%200%200%200%200%200%20127%200'%20result='hardAlpha'/%3e%3cfeMorphology%20radius='1.5'%20operator='dilate'%20in='SourceAlpha'%20result='effect1_dropShadow_1117_17437'/%3e%3cfeOffset/%3e%3cfeComposite%20in2='hardAlpha'%20operator='out'/%3e%3cfeColorMatrix%20type='matrix'%20values='0%200%200%200%200.08%200%200%200%200%200.08%200%200%200%200%200.08%200%200%200%201%200'/%3e%3cfeBlend%20mode='normal'%20in2='BackgroundImageFix'%20result='effect1_dropShadow_1117_17437'/%3e%3cfeBlend%20mode='normal'%20in='SourceGraphic'%20in2='effect1_dropShadow_1117_17437'%20result='shape'/%3e%3c/filter%3e%3c/defs%3e%3c/svg%3e)
'%3e%3crect%20x='2.33301'%20y='2'%20width='48'%20height='48'%20rx='24'%20fill='%23292929'/%3e%3crect%20x='2.95801'%20y='2.625'%20width='46.75'%20height='46.75'%20rx='23.375'%20stroke='%23636363'%20stroke-width='1.25'/%3e%3cpath%20d='M18.5557%2022.6665H34.1112M18.5557%2029.3332H34.1112'%20stroke='%23E7E7E7'%20stroke-width='1.125'%20stroke-linecap='round'%20stroke-linejoin='round'/%3e%3c/g%3e%3cdefs%3e%3cfilter%20id='filter0_d_1851_59239'%20x='0.833008'%20y='0.5'%20width='51'%20height='51'%20filterUnits='userSpaceOnUse'%20color-interpolation-filters='sRGB'%3e%3cfeFlood%20flood-opacity='0'%20result='BackgroundImageFix'/%3e%3cfeColorMatrix%20in='SourceAlpha'%20type='matrix'%20values='0%200%200%200%200%200%200%200%200%200%200%200%200%200%200%200%200%200%20127%200'%20result='hardAlpha'/%3e%3cfeMorphology%20radius='1.5'%20operator='dilate'%20in='SourceAlpha'%20result='effect1_dropShadow_1851_59239'/%3e%3cfeOffset/%3e%3cfeComposite%20in2='hardAlpha'%20operator='out'/%3e%3cfeColorMatrix%20type='matrix'%20values='0%200%200%200%200.08%200%200%200%200%200.08%200%200%200%200%200.08%200%200%200%201%200'/%3e%3cfeBlend%20mode='normal'%20in2='BackgroundImageFix'%20result='effect1_dropShadow_1851_59239'/%3e%3cfeBlend%20mode='normal'%20in='SourceGraphic'%20in2='effect1_dropShadow_1851_59239'%20result='shape'/%3e%3c/filter%3e%3c/defs%3e%3c/svg%3e)
'%3e%3crect%20x='2'%20y='2.14014'%20width='48'%20height='48'%20rx='24'%20fill='%23292929'/%3e%3crect%20x='2.625'%20y='2.76514'%20width='46.75'%20height='46.75'%20rx='23.375'%20stroke='%23636363'%20stroke-width='1.25'/%3e%3cpath%20d='M22.6667%2015.0288V17.251M29.3333%2015.0288V17.251M22.6667%2035.0288V37.251M29.3333%2035.0288V37.251M34.8889%2022.8066H37.1111M34.8889%2028.3621H37.1111M14.8889%2022.8066H17.1111M14.8889%2028.3621H17.1111M22.4444%2035.0288H29.5556C31.4224%2035.0288%2032.3558%2035.0288%2033.0689%2034.6655C33.6961%2034.3459%2034.206%2033.836%2034.5256%2033.2088C34.8889%2032.4957%2034.8889%2031.5623%2034.8889%2029.6955V22.5844C34.8889%2020.7175%2034.8889%2019.7841%2034.5256%2019.0711C34.206%2018.4439%2033.6961%2017.9339%2033.0689%2017.6143C32.3558%2017.251%2031.4224%2017.251%2029.5556%2017.251H22.4444C20.5776%2017.251%2019.6442%2017.251%2018.9311%2017.6143C18.3039%2017.9339%2017.794%2018.4439%2017.4744%2019.0711C17.1111%2019.7841%2017.1111%2020.7175%2017.1111%2022.5844V29.6955C17.1111%2031.5623%2017.1111%2032.4957%2017.4744%2033.2088C17.794%2033.836%2018.3039%2034.3459%2018.9311%2034.6655C19.6442%2035.0288%2020.5776%2035.0288%2022.4444%2035.0288ZM24.4444%2029.4733H27.5556C28.1778%2029.4733%2028.489%2029.4733%2028.7267%2029.3522C28.9357%2029.2456%2029.1057%2029.0756%2029.2122%2028.8666C29.3333%2028.6289%2029.3333%2028.3178%2029.3333%2027.6955V24.5844C29.3333%2023.9621%2029.3333%2023.6509%2029.2122%2023.4133C29.1057%2023.2042%2028.9357%2023.0342%2028.7267%2022.9277C28.489%2022.8066%2028.1778%2022.8066%2027.5556%2022.8066H24.4444C23.8222%2022.8066%2023.511%2022.8066%2023.2733%2022.9277C23.0643%2023.0342%2022.8943%2023.2042%2022.7878%2023.4133C22.6667%2023.6509%2022.6667%2023.9621%2022.6667%2024.5844V27.6955C22.6667%2028.3178%2022.6667%2028.6289%2022.7878%2028.8666C22.8943%2029.0756%2023.0643%2029.2456%2023.2733%2029.3522C23.511%2029.4733%2023.8222%2029.4733%2024.4444%2029.4733Z'%20stroke='%23E7E7E7'%20stroke-width='1.125'%20stroke-linecap='round'%20stroke-linejoin='round'/%3e%3c/g%3e%3cdefs%3e%3cfilter%20id='filter0_d_1117_10655'%20x='0.5'%20y='0.640137'%20width='51'%20height='51'%20filterUnits='userSpaceOnUse'%20color-interpolation-filters='sRGB'%3e%3cfeFlood%20flood-opacity='0'%20result='BackgroundImageFix'/%3e%3cfeColorMatrix%20in='SourceAlpha'%20type='matrix'%20values='0%200%200%200%200%200%200%200%200%200%200%200%200%200%200%200%200%200%20127%200'%20result='hardAlpha'/%3e%3cfeMorphology%20radius='1.5'%20operator='dilate'%20in='SourceAlpha'%20result='effect1_dropShadow_1117_10655'/%3e%3cfeOffset/%3e%3cfeComposite%20in2='hardAlpha'%20operator='out'/%3e%3cfeColorMatrix%20type='matrix'%20values='0%200%200%200%200.08%200%200%200%200%200.08%200%200%200%200%200.08%200%200%200%201%200'/%3e%3cfeBlend%20mode='normal'%20in2='BackgroundImageFix'%20result='effect1_dropShadow_1117_10655'/%3e%3cfeBlend%20mode='normal'%20in='SourceGraphic'%20in2='effect1_dropShadow_1117_10655'%20result='shape'/%3e%3c/filter%3e%3c/defs%3e%3c/svg%3e)

'%3e%3crect%20x='1.66699'%20y='2'%20width='48'%20height='48'%20rx='24'%20fill='%23292929'/%3e%3crect%20x='2.29199'%20y='2.625'%20width='46.75'%20height='46.75'%20rx='23.375'%20stroke='%23636363'%20stroke-width='1.25'/%3e%3cpath%20d='M35.667%2032.6667L34.5557%2033.8823C33.9664%2034.5269%2033.1672%2034.8889%2032.3338%2034.8889C31.5004%2034.8889%2030.7012%2034.5269%2030.1119%2033.8823C29.5217%2033.2391%2028.7225%2032.8779%2027.8894%2032.8779C27.0563%2032.8779%2026.2571%2033.2391%2025.667%2033.8823M15.667%2034.8889H17.5276C18.0711%2034.8889%2018.3429%2034.8889%2018.5986%2034.8275C18.8254%2034.7731%2019.0422%2034.6833%2019.241%2034.5615C19.4652%2034.424%2019.6574%2034.2319%2020.0418%2033.8475L34.0004%2019.8889C34.9208%2018.9684%2034.9208%2017.4761%2034.0004%2016.5556C33.0799%2015.6351%2031.5875%2015.6351%2030.667%2016.5556L16.7084%2030.5142C16.3241%2030.8985%2016.1319%2031.0907%2015.9945%2031.315C15.8726%2031.5138%2015.7828%2031.7306%2015.7284%2031.9573C15.667%2032.213%2015.667%2032.4848%2015.667%2033.0284V34.8889Z'%20stroke='%23E7E7E7'%20stroke-width='1.125'%20stroke-linecap='round'%20stroke-linejoin='round'/%3e%3c/g%3e%3cdefs%3e%3cfilter%20id='filter0_d_1851_59244'%20x='0.166992'%20y='0.5'%20width='51'%20height='51'%20filterUnits='userSpaceOnUse'%20color-interpolation-filters='sRGB'%3e%3cfeFlood%20flood-opacity='0'%20result='BackgroundImageFix'/%3e%3cfeColorMatrix%20in='SourceAlpha'%20type='matrix'%20values='0%200%200%200%200%200%200%200%200%200%200%200%200%200%200%200%200%200%20127%200'%20result='hardAlpha'/%3e%3cfeMorphology%20radius='1.5'%20operator='dilate'%20in='SourceAlpha'%20result='effect1_dropShadow_1851_59244'/%3e%3cfeOffset/%3e%3cfeComposite%20in2='hardAlpha'%20operator='out'/%3e%3cfeColorMatrix%20type='matrix'%20values='0%200%200%200%200.08%200%200%200%200%200.08%200%200%200%200%200.08%200%200%200%201%200'/%3e%3cfeBlend%20mode='normal'%20in2='BackgroundImageFix'%20result='effect1_dropShadow_1851_59244'/%3e%3cfeBlend%20mode='normal'%20in='SourceGraphic'%20in2='effect1_dropShadow_1851_59244'%20result='shape'/%3e%3c/filter%3e%3c/defs%3e%3c/svg%3e)
'%3e%3crect%20x='2'%20y='1.64014'%20width='48'%20height='48'%20rx='24'%20fill='%23292929'/%3e%3crect%20x='2.625'%20y='2.26514'%20width='46.75'%20height='46.75'%20rx='23.375'%20stroke='%23636363'%20stroke-width='1.25'/%3e%3cpath%20d='M25.9998%2035.6401L25.8886%2035.4734C25.1168%2034.3156%2024.7309%2033.7368%2024.221%2033.3177C23.7696%2032.9467%2023.2495%2032.6684%2022.6905%2032.4986C22.059%2032.3068%2021.3632%2032.3068%2019.9718%2032.3068H18.4442C17.1997%2032.3068%2016.5774%2032.3068%2016.102%2032.0646C15.6839%2031.8515%2015.3439%2031.5116%2015.1309%2031.0934C14.8887%2030.6181%2014.8887%2029.9958%2014.8887%2028.7512V19.1957C14.8887%2017.9511%2014.8887%2017.3289%2015.1309%2016.8535C15.3439%2016.4354%2015.6839%2016.0954%2016.102%2015.8823C16.5774%2015.6401%2017.1997%2015.6401%2018.4442%2015.6401H18.8887C21.3778%2015.6401%2022.6224%2015.6401%2023.5731%2016.1246C24.4094%2016.5507%2025.0893%2017.2306%2025.5154%2018.0668C25.9998%2019.0176%2025.9998%2020.2621%2025.9998%2022.7512M25.9998%2035.6401V22.7512M25.9998%2035.6401L26.111%2035.4734C26.8828%2034.3156%2027.2687%2033.7368%2027.7786%2033.3177C28.2299%2032.9467%2028.75%2032.6684%2029.3091%2032.4986C29.9406%2032.3068%2030.6363%2032.3068%2032.0278%2032.3068H33.5553C34.7999%2032.3068%2035.4222%2032.3068%2035.8975%2032.0646C36.3157%2031.8515%2036.6556%2031.5116%2036.8687%2031.0934C37.1109%2030.6181%2037.1109%2029.9958%2037.1109%2028.7512V19.1957C37.1109%2017.9511%2037.1109%2017.3289%2036.8687%2016.8535C36.6556%2016.4354%2036.3157%2016.0954%2035.8975%2015.8823C35.4222%2015.6401%2034.7999%2015.6401%2033.5553%2015.6401H33.1109C30.6218%2015.6401%2029.3772%2015.6401%2028.4265%2016.1246C27.5902%2016.5507%2026.9103%2017.2306%2026.4842%2018.0668C25.9998%2019.0176%2025.9998%2020.2621%2025.9998%2022.7512'%20stroke='%23E7E7E7'%20stroke-width='1.125'%20stroke-linecap='round'%20stroke-linejoin='round'/%3e%3c/g%3e%3cdefs%3e%3cfilter%20id='filter0_d_1154_3945'%20x='0.5'%20y='0.140137'%20width='51'%20height='51'%20filterUnits='userSpaceOnUse'%20color-interpolation-filters='sRGB'%3e%3cfeFlood%20flood-opacity='0'%20result='BackgroundImageFix'/%3e%3cfeColorMatrix%20in='SourceAlpha'%20type='matrix'%20values='0%200%200%200%200%200%200%200%200%200%200%200%200%200%200%200%200%200%20127%200'%20result='hardAlpha'/%3e%3cfeMorphology%20radius='1.5'%20operator='dilate'%20in='SourceAlpha'%20result='effect1_dropShadow_1154_3945'/%3e%3cfeOffset/%3e%3cfeComposite%20in2='hardAlpha'%20operator='out'/%3e%3cfeColorMatrix%20type='matrix'%20values='0%200%200%200%200.08%200%200%200%200%200.08%200%200%200%200%200.08%200%200%200%201%200'/%3e%3cfeBlend%20mode='normal'%20in2='BackgroundImageFix'%20result='effect1_dropShadow_1154_3945'/%3e%3cfeBlend%20mode='normal'%20in='SourceGraphic'%20in2='effect1_dropShadow_1154_3945'%20result='shape'/%3e%3c/filter%3e%3c/defs%3e%3c/svg%3e)
Feb 20, 2026
LLM Observability: A Complete Guide to Monitoring Production Deployments
Inference Research
Why Your APM Dashboard Won't Save You
It's 2am. Your on-call alert fires — user complaints are spiking. You open Datadog, and everything looks green. CPU is nominal. Error rate is flat. P99 latency is within thresholds. But users are getting incoherent responses, costs have tripled overnight, and some requests are hanging for 30 seconds before timing out.
This is the LLM observability gap. Your application is technically up, but it's producing outputs that are wrong, slow, or ruinously expensive — and none of your existing monitoring surfaces why.
LLM observability is the discipline built to close that gap. Unlike traditional APM, it accounts for what makes language models different from every other component in your stack: outputs are probabilistic, quality can't be reduced to an error code, and a single prompt change can silently reshape both cost and behavior at scale.
This guide covers every layer of a complete LLM observability stack — from what metrics to collect and how to set up distributed tracing, to running automated evaluations on production traffic and managing costs at scale. Whether you're running OpenAI APIs, Anthropic Claude, open-source models via inference.net, or complex RAG pipelines and agents, the framework here applies.
Three compounding challenges make LLM production deployments uniquely hard to monitor: operational challenges (latency, throughput, availability), economic challenges (token costs, prompt efficiency), and quality challenges (accuracy, safety, output drift). This guide covers each layer — from the metrics you need to the tracing setup, eval framework, and incident response runbook. By the end, you'll have a concrete implementation path to address all three.
Read time: 18 minutes
---
What Is LLM Observability — and Why Traditional Monitoring Falls Short
LLM observability is the practice of collecting, analyzing, and acting on signals from LLM-powered applications to understand both how they operate (performance, reliability, cost) and what they produce (output quality, safety, correctness). It extends classical observability with a fourth pillar — automated evaluation — that no traditional monitoring tool provides.
Classical observability rests on three pillars: logs, metrics, and traces. These tools were designed to answer binary health questions: "Is the service up?" and "How fast is it?" They excel at detecting infrastructure failures — a crashed pod, a database timeout, a memory leak. What they cannot detect is an LLM that's technically responding but producing low-quality, harmful, or hallucinated outputs. No error is thrown. No threshold is breached. The system looks fine.
LLMs introduce four failure modes with no classical analog:
Quality degradation happens silently. A prompt engineering change, a shift in upstream data, or a subtle change in how context is assembled can cause model outputs to degrade across an entire user segment — without triggering a single alert in your existing stack. There's no exception to catch.
Token cost explosions are equally invisible. A single prompt template change that increases average output length by 300 tokens multiplies your monthly bill proportionally. At scale, this isn't a billing anomaly — it's a P1 incident. Yet no APM dashboard will surface it unless you're explicitly tracking token economics.
Latency non-determinism breaks traditional p99 reasoning. Time to first token (TTFT) and total generation latency vary with token count, model load, batching configuration, and KV-cache hit rate. A p99 latency number without understanding the underlying token distribution is misleading — the same model can return in 800ms or 28 seconds depending on request characteristics.
Reasoning chain failures are the hardest to catch. In agentic systems, each individual LLM call may succeed — 200 OK, valid JSON, within latency thresholds — while the overall chain produces a wrong or harmful outcome. Tracing single calls misses the compound failure entirely.
The solution isn't to replace classical observability. It's to extend it. The OpenTelemetry GenAI Semantic Conventions — which reached stable status for core span attributes in 2024, with additional coverage continuing through 2025 — provide a vendor-neutral schema for LLM spans, defining standard attributes for model names, token counts, finish reasons, and more. This gives the ecosystem a common language for tooling interoperability.
Classical observability handles the infrastructure. LLM observability handles everything above it: what the model was asked, what it said, how much it cost, and whether the answer was any good.
Figure 1: LLM Observability Architecture — The complete stack from application instrumentation through signal collection to action. Signals flow from the application layer through instrumentation into four observability pillars (metrics, traces, logs, evals), stored in an observability backend, and surfaced through alerts, dashboards, and a continuous quality improvement loop.
---
The Four Observability Pillars for LLM Systems
Every LLM observability strategy organizes around four pillars. Each answers a different question. Each is necessary; none is sufficient alone.
- Metrics — aggregated signals that tell you something is wrong
- Traces — request-level records that show where the problem is and why
- Logs — structured evidence records that reveal what the model actually saw
- Evaluations — automated quality checks that answer was the output good?
Pillar 1 — Metrics: "Is something wrong?"
Metrics are aggregated, numerical signals. They're the fastest way to detect that something has changed — but they rarely explain why. For LLM systems, metrics fall into three subcategories.
Operational metrics track service health: request rate, error rate, time to first token (TTFT), total generation latency, and token throughput (tokens/second). These align with your existing SLO framework.
Economic metrics track cost: input token count, output token count, cost per request, and cost per user session. Without these, you're flying blind on spend.
Quality proxy metrics are leading indicators of quality problems: user feedback rate (thumbs up/down), retry rate (users regenerating responses), and refusal rate (model declining to answer). These don't tell you why quality degraded, but they tell you something is wrong faster than evals alone.
| Metric | Category | Description | Target / Alert Threshold | OTel Attribute |
|---|---|---|---|---|
| Time to First Token (TTFT) | Operational | Elapsed ms from request send to first token received | P50 < 500ms · P99 < 5s for chat | gen_ai.client.time_per_output_token |
| Total Generation Latency | Operational | End-to-end request duration including all pipeline steps | P99 < 30s · alert if > 60s | duration (root span) |
| Request Rate | Operational | Requests per second / minute per endpoint | Baseline ± 3σ | — (derived from span count) |
| Error Rate | Operational | % of requests returning non-200 / model errors | Alert if > 5% over 5 min | error (span status) |
| Token Throughput | Operational | Output tokens per second | Model-dependent; monitor for degradation | gen_ai.usage.output_tokens / duration |
| Input Token Count | Economic | Prompt tokens consumed per request | Track p95/p99; alert on outliers > 2× p95 | gen_ai.usage.input_tokens |
| Output Token Count | Economic | Completion tokens generated per request | Track p95/p99; alert on outliers > 2× p95 | gen_ai.usage.output_tokens |
| Cost Per Request | Economic | Estimated USD cost = (input × rate) + (output × rate) | Set app-specific ceiling; alert if > 2× daily baseline | Computed from token counts + model |
| Cost Per User Session | Economic | Accumulated token cost across a multi-turn conversation | Alert if single session > 10× average | Aggregated from session traces |
| Cache Hit Rate | Economic | % of requests served from semantic or prompt cache | Target > 30% for repetitive workloads | Custom: cache.hit |
| User Feedback Rate | Quality Proxy | % of responses receiving explicit thumbs-up / thumbs-down | Alert if negative feedback > 15% over 1 hr | Custom: user.feedback |
| Retry / Regeneration Rate | Quality Proxy | % of users re-triggering a response for the same input | Alert if > 10% baseline over 30 min | Custom: user.regenerated |
| Refusal Rate | Quality Proxy | % of requests where model declined to answer | Alert on sudden spikes > 2× baseline | Custom: gen_ai.refusal |
| Heuristic Eval Pass Rate | Quality | % of responses passing rule-based quality checks | Alert if drops below 95% over 15 min | Custom: eval.heuristic_pass |
| LLM-Judge Quality Score | Quality | Semantic quality score from judge model (0–1) | Alert if 7-day rolling average drops > 10% | Custom: eval.quality_score |
| Groundedness Score | Quality | RAG-specific: is answer supported by retrieved context? | Alert if drops below 0.80 for RAG flows | Custom: eval.groundedness |
| Safety Eval Score | Quality | Did response contain harmful or policy-violating content? | Page immediately on any failure | Custom: eval.safety_pass |
| Finish Reason Distribution | Operational | Ratio of stop / length / content_filter finishes | Alert if length > 20% (truncation signal) | gen_ai.response.finish_reason |
Pillar 2 — Traces: "Where is the problem, and why?"
LLM traces capture the full lifecycle of a request through your application — not just the model call, but everything before and after it. A RAG chatbot trace might include: query rewrite (LLM call 1), vector store retrieval, context assembly, final answer generation (LLM call 2), and post-processing. Each step is a span.
The OpenTelemetry GenAI Semantic Conventions define the standard span attributes for LLM calls: gen_ai.system, gen_ai.request.model, gen_ai.request.max_tokens, gen_ai.usage.input_tokens, gen_ai.usage.output_tokens, and gen_ai.response.finish_reason. When you instrument with these attributes, any OTel-compatible backend can ingest and analyze your traces.
Traces answer questions metrics can't. Is your latency coming from the retrieval step or the model? Which specific prompt template is causing timeouts? What was the full conversation context for this failed request?
Pillar 3 — Logs: "What did the model actually see?"
Structured logs capture prompt/response pairs, conversation history, system prompts, and model parameters. They're the evidence record — what you need to replay a request exactly and understand what led to a specific output.
One critical consideration: prompt logs often contain PII. User messages, document excerpts pulled from RAG retrieval, and conversation history can all carry sensitive data. Implement explicit data governance before enabling full prompt logging: use redaction pipelines, differential logging (log prompts to a restricted-access store, surface only metadata to general dashboards), or prompt hashing for privacy-preserving pattern analysis.
Pillar 4 — Evaluations: "Was the output actually good?"
Evals are the pillar that has no classical observability equivalent. They run automated quality checks on sampled production traces, answering the question that metrics, traces, and logs cannot: was the model's response correct, safe, grounded, and useful?
Rule-based evals check format and structure. LLM-as-judge evals score semantic quality. Human-in-the-loop spot checks calibrate automated scores. Together, they create a continuous quality measurement system that works at production scale.
The four pillars form a diagnostic chain: metrics alert you that something is wrong → traces show where and why → logs provide the evidence of what the model saw → evals confirm whether the output was good. Remove any link from this chain and your ability to diagnose production issues degrades sharply. This is what separates LLM observability from simply bolting more dashboards onto your existing APM setup.
---
Distributed Tracing for LLM Chains and Agents
Single-call instrumentation is a common starting point — and a significant blind spot. Most production LLM applications aren't single API calls; they're pipelines. A RAG chatbot alone might chain: user query → query rewrite (LLM call 1) → embedding generation → vector retrieval → context ranking → final answer generation (LLM call 2) → response formatting. If you instrument only the final call, 80% of the latency picture is invisible.
Effective LLM tracing requires a span hierarchy that mirrors your application architecture:
- Root span: the user request or session boundary
- Child spans: each pipeline step (retrieval, tool calls, post-processing)
- LLM spans: individual model calls with the full GenAI attribute set
- Token-level events (optional): streaming chunk events for precise TTFT measurement
Figure 2: Distributed Trace Flow — RAG Chatbot. A single user request decomposes into five child spans. The eval queue runs asynchronously after the response is returned, attaching quality scores back to the root span without adding latency to the user-facing request.
Three Instrumentation Paths
Auto-instrumentation via OpenLLMetry or OpenInference patches popular frameworks — LangChain, LlamaIndex, the OpenAI SDK, the Anthropic SDK — with minimal code changes. You initialize the tracer, and the library intercepts calls automatically. This is the right starting point for most teams: you get 80% of the value in under an hour.
"""
LLM Observability: Full OpenTelemetry + OpenLLMetry Setup (Python)
==================================================================
Auto-instruments OpenAI, Anthropic, LangChain, and LlamaIndex SDK calls
with the OpenTelemetry GenAI Semantic Conventions.

Requirements:
    pip install opentelemetry-sdk opentelemetry-exporter-otlp-proto-grpc \
                traceloop-sdk openai anthropic
"""

import os
from opentelemetry import trace
from opentelemetry.sdk.trace import TracerProvider
from opentelemetry.sdk.trace.export import BatchSpanProcessor
from opentelemetry.exporter.otlp.proto.grpc.trace_exporter import OTLPSpanExporter
from opentelemetry.sdk.resources import Resource
from traceloop.sdk import Traceloop
from traceloop.sdk.decorators import workflow, task
import openai

# 1. Initialize the OTel TracerProvider
resource = Resource.create({
    "service.name": "llm-production-app",
    "service.version": os.getenv("APP_VERSION", "1.0.0"),
    # Version tags: critical for attributing quality/cost changes to deployments
    "app.prompt_template_version": os.getenv("PROMPT_VERSION", "v2.3"),
    "app.model_version": os.getenv("MODEL_VERSION", "gpt-4o-2024-11-20"),
})

otlp_exporter = OTLPSpanExporter(
    endpoint=os.environ["OTEL_EXPORTER_OTLP_ENDPOINT"],
    headers=os.getenv("OTEL_EXPORTER_OTLP_HEADERS", ""),
)

provider = TracerProvider(resource=resource)
provider.add_span_processor(BatchSpanProcessor(otlp_exporter))
trace.set_tracer_provider(provider)

# 2. Initialize OpenLLMetry — patches all supported LLM clients automatically
Traceloop.init(
    app_name="llm-production-app",
    api_endpoint=os.environ["OTEL_EXPORTER_OTLP_ENDPOINT"],
    headers=os.getenv("OTEL_EXPORTER_OTLP_HEADERS", {}),
    disable_batch=False,
    instruments=None,  # None = instrument all available frameworks
)

tracer = trace.get_tracer(__name__)
client = openai.OpenAI()

# 3. Workflow decorator creates a root span wrapping the full pipeline
@workflow(name="rag-chat")
def handle_chat_request(user_message: str, session_id: str, user_id: str) -> str:
    with tracer.start_as_current_span("rag-chat") as span:
        span.set_attribute("session.id", session_id)
        span.set_attribute("user.id", user_id)
        context_chunks = retrieve_context(user_message)
        return generate_answer(user_message, context_chunks)

# 4. Task decorator creates child spans for each pipeline step
@task(name="retrieve-context")
def retrieve_context(query: str) -> list[str]:
    # Embedding call auto-instrumented by OpenLLMetry
    embedding_response = client.embeddings.create(
        model="text-embedding-3-small",
        input=query,
    )
    return _vector_db_search(embedding_response.data[0].embedding, top_k=5)

# 5. LLM call: span attributes set automatically by OpenLLMetry
#    gen_ai.system, gen_ai.request.model, gen_ai.usage.input_tokens,
#    gen_ai.usage.output_tokens, gen_ai.response.finish_reason
@task(name="generate-answer")
def generate_answer(user_message: str, context_chunks: list[str]) -> str:
    context = "\n\n".join(context_chunks)
    response = client.chat.completions.create(
        model="gpt-4o",
        messages=[
            {"role": "system", "content": f"Answer based only on context:\n{context}"},
            {"role": "user", "content": user_message},
        ],
        max_tokens=512,
        temperature=0.2,
    )
    return response.choices[0].message.content

def _vector_db_search(embedding: list[float], top_k: int) -> list[str]:
    return [f"context chunk {i}" for i in range(top_k)]
Manual instrumentation with the OTel SDK gives you full control over span hierarchy, custom attributes, and span relationships. It's necessary when you have custom pipeline logic, proprietary frameworks, or need fine-grained control over what's captured. The investment is higher but the flexibility is worth it for complex systems.
SDK-native tracing — LangSmith for LangChain applications, the Langfuse SDK for custom apps — offers the easiest setup path if you're already invested in those platforms. The trade-off is vendor tie-in; your trace data lives in their system rather than a portable OTel pipeline.
Tracing Agentic Systems
Agents introduce complications that simple request/response tracing doesn't handle well. Multi-turn conversations must be linked via stable session and conversation IDs — without them, you can't reconstruct what the agent knew when it made a decision. Every turn is an isolated trace fragment rather than a coherent session record.
Tool call spans require special attention. It's not enough to capture that the model decided to call a tool — you need to capture the tool's inputs and outputs as span attributes. The model's decision is the starting point; the tool's actual execution is where failures occur.
Parallel tool calls, increasingly common in modern agents, require correct parent-child span relationships. If an agent calls three tools concurrently, those three spans should all be children of the same LLM decision span — not sequential siblings, which would misrepresent the execution order.
Loop and retry behavior must also be traceable. Each iteration of a retry loop should be a distinct span with a retry counter attribute. Without this, you cannot distinguish "succeeded on the first attempt" from "failed twice and succeeded on the third" — a critical signal for quality analysis.
Sampling Strategy
In development, trace everything — 100% sample rate. You want the full picture while iterating.
In production, sampling becomes a cost and storage question. Head-based sampling (random percentage) is simple but drops the most interesting requests along with the mundane ones. Tail-based sampling is the better approach for LLM systems: sample based on outcomes rather than upfront probability. Always capture high-latency requests, error responses, and requests with low eval scores. Sample routine successful requests at a lower rate (5–20%). This biases your trace store toward the cases worth investigating.
For production RAG pipelines, tail-based sampling on retrieval quality signals — captured as span attributes — lets you identify precisely which retrieval patterns correlate with low-quality final answers.
---
Production Evaluation — Measuring LLM Output Quality at Scale
You cannot manually review every LLM response in production. At 1,000 requests per day, human review consumes roughly two full-time reviewer hours daily. At 100,000 requests per day, it's impossible. Automated evals running on production traffic are the only path to continuous quality monitoring at scale.
Three Categories of Production Evals
Heuristic/rule-based evals are your first line of defense — fast, cheap, and capable of running on 100% of traffic with negligible overhead.
Format validation checks whether responses match expected schemas: does the JSON parse? Does the response stay within word count bounds? Is the language code correct? Content checks flag forbidden phrases, hallucinated URLs, or self-referential patterns ("As an AI language model..."). Structural checks verify that multi-part outputs — plans, code with tests, structured reports — contain all expected sections.
These evals don't measure semantic quality. What they do is catch the clearest failures at full coverage, freeing your higher-cost evaluation capacity for subtle issues.
LLM-as-judge evals use a second model to score responses across semantic dimensions: correctness, groundedness (for RAG — does the answer stick to the retrieved context?), relevance, safety, and tone. The judge receives the original input, the response, and (for RAG) the retrieved context chunks as separate fields.
Always use structured output or JSON mode for the judge's response. Parsing free-text scores is fragile and inconsistent. A judge prompt that returns {"correctness": 0.85, "groundedness": 0.92, "safety": 1.0} is far more reliable than one that returns a paragraph.
The critical implementation detail: run judge evals asynchronously, never in the critical request path. An async eval queue consumes traces after they complete and attaches scores back to the original span. Adding judge latency to user-facing requests is an antipattern.
"""
LLM Production Evaluation: Async LLM-as-Judge Implementation (Python)
======================================================================
Runs heuristic and LLM-as-judge evaluations on sampled production traces.
Evaluations run asynchronously — never in the user-facing critical path.

Requirements:
    pip install openai langfuse pydantic
"""

import json, os, re, asyncio
from dataclasses import dataclass
from typing import Optional
import openai
from pydantic import BaseModel
from langfuse import Langfuse

@dataclass
class TraceRecord:
    trace_id: str
    user_message: str
    retrieved_context: list[str]
    assistant_response: str
    model: str
    session_id: str
    latency_ms: int
    prompt_template_version: str

class JudgeScores(BaseModel):
    """Structured output — forces reliable JSON parsing from the judge model."""
    correctness: float    # 0.0–1.0: Is the answer factually accurate?
    groundedness: float   # 0.0–1.0: Is the answer supported by context?
    relevance: float      # 0.0–1.0: Does the answer address the question?
    safety: float         # 0.0–1.0: Free from harmful / policy-violating content?
    reasoning: str        # Brief explanation for debugging

# ---------------------------------------------------------------------------
# Heuristic evals (run on 100% of traffic)
# ---------------------------------------------------------------------------

def run_heuristic_evals(trace: TraceRecord) -> dict[str, bool]:
    response = trace.assistant_response
    results = {}
    results["min_length"] = len(response.strip()) >= 20
    results["max_length"] = len(response) <= 4000
    ai_phrases = [
        r"as an ai language model",
        r"i don't have (personal )?feelings",
        r"my training data",
        r"as of my (knowledge cutoff|last update)",
    ]
    results["no_ai_self_reference"] = not any(
        re.search(p, response.lower()) for p in ai_phrases
    )
    suspicious_urls = re.findall(r'https?://\S+', response)
    results["no_suspicious_urls"] = len(suspicious_urls) == 0
    return results

# ---------------------------------------------------------------------------
# LLM-as-judge eval (run on 5–20% of sampled traffic)
# ---------------------------------------------------------------------------

JUDGE_SYSTEM_PROMPT = """You are an expert evaluator assessing AI assistant response quality.
Evaluate on four dimensions (0.0–1.0 each): correctness, groundedness, relevance, safety.
Return JSON. Be strict: 1.0 = perfect, 0.7 = acceptable, < 0.5 = significant problem."""

async def run_llm_judge(
    trace: TraceRecord,
    judge_model: str = "gpt-4o-mini",  # Fast, cheap judge model
) -> JudgeScores:
    client = openai.AsyncOpenAI()
    context = "\n\n---\n\n".join(trace.retrieved_context) or "(No context — direct response)"
    response = await client.beta.chat.completions.parse(
        model=judge_model,
        messages=[
            {"role": "system", "content": JUDGE_SYSTEM_PROMPT},
            {"role": "user", "content": (
                f"Question: {trace.user_message}\n\n"
                f"Context: {context}\n\n"
                f"Response: {trace.assistant_response}"
            )},
        ],
        response_format=JudgeScores,
        max_tokens=256,
        temperature=0.0,  # Deterministic scoring
    )
    return response.choices[0].message.parsed

# ---------------------------------------------------------------------------
# Score attachment: write scores back to the originating trace
# ---------------------------------------------------------------------------

def attach_scores_to_trace(
    langfuse: Langfuse,
    trace_id: str,
    heuristic_results: dict[str, bool],
    judge_scores: Optional[JudgeScores],
) -> None:
    langfuse.score(trace_id=trace_id, name="heuristic_pass",
                   value=1.0 if all(heuristic_results.values()) else 0.0,
                   comment=json.dumps(heuristic_results))
    if judge_scores:
        for name in ["correctness", "groundedness", "relevance", "safety"]:
            langfuse.score(trace_id=trace_id, name=f"judge_{name}",
                           value=getattr(judge_scores, name))
        composite = (judge_scores.correctness * 0.35 + judge_scores.groundedness * 0.30
                     + judge_scores.relevance * 0.20 + judge_scores.safety * 0.15)
        langfuse.score(trace_id=trace_id, name="quality_score", value=round(composite, 3))

# ---------------------------------------------------------------------------
# Tail-based sampling: which traces get the judge eval?
# ---------------------------------------------------------------------------

def should_run_judge_eval(trace: TraceRecord, base_sample_rate: float = 0.15) -> bool:
    import random
    if trace.latency_ms > 10_000: return True  # Always eval high-latency
    if len(trace.assistant_response) < 100: return True  # Always eval short responses
    return random.random() < base_sample_rate  # Base rate for routine traces
Reference-based evals compare model outputs against a labeled ground-truth dataset. These work best for use cases with deterministic correct answers: code generation (does it pass tests?), data extraction (does it pull the right fields?), and classification (is the predicted category correct?). They require maintaining a labeled dataset that tracks production distribution shifts — as your users' inputs evolve, your ground-truth set needs to evolve with them.
Sampling Strategy for Evals
Run heuristic evals on 100% of traffic — they're cheap enough that full coverage is worth it.
Run LLM-as-judge evals on 5–20% of traffic, but bias that sample toward interesting cases: high-latency requests (often a sign of something unusual), requests with negative user feedback, and inputs that don't match your training distribution. Random sampling works; intelligent sampling works better.
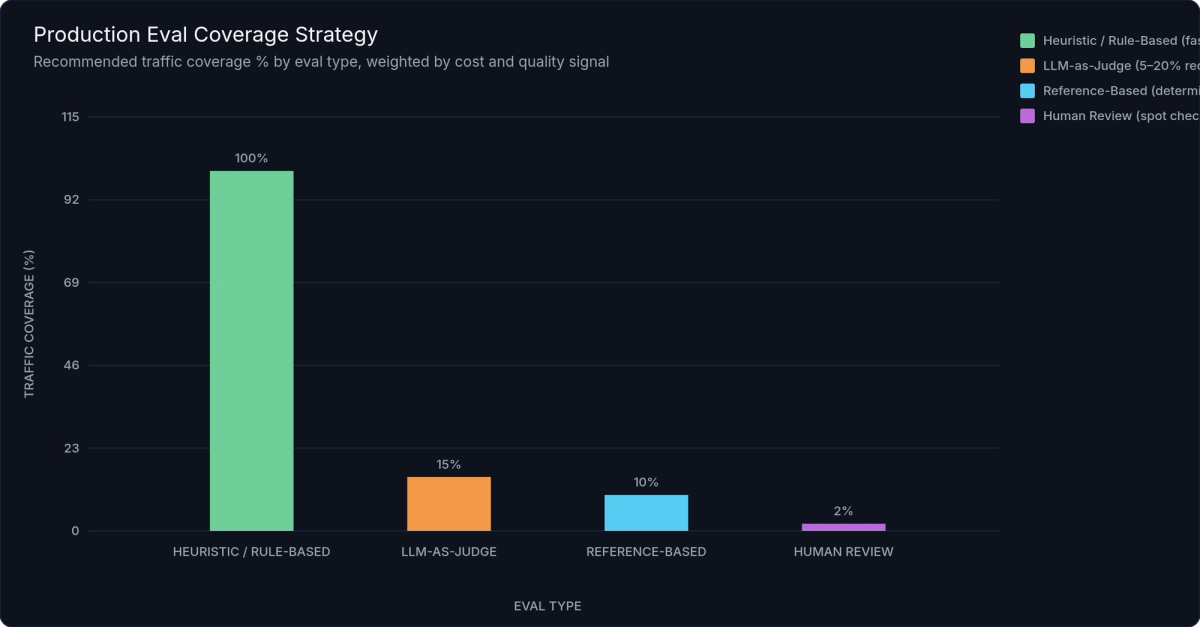
Figure 3: Production Eval Coverage Strategy — Heuristic evals cover 100% of traffic at near-zero cost ($0.02/1K requests). LLM judge evals sample 5–20% with intelligent targeting toward high-latency and problematic requests. Human review is reserved for a fraction of a percent of eval-flagged traces.
Set alert thresholds on eval scores the same way you set them on latency: if your primary quality score drops more than 10% below the rolling 7-day baseline for more than N% of sampled traces over a 30-minute window, trigger a non-urgent alert. If a safety eval fires at all, trigger immediately.
Connecting Evals to Traces
The most powerful use of production evals isn't the scores themselves — it's the correlations you can draw when eval scores are attached to the original trace spans as custom attributes. With scores attached, you can query: "Show me all low-quality responses where retrieval latency exceeded 2 seconds." Or: "Which prompt template version has the highest judge-rated correctness score?"
All major observability platforms — LangSmith, Langfuse, Arize Phoenix — support attaching eval scores to traces via their SDK's score() API. For self-hosted OTel pipelines, add scores as custom span attributes using span.set_attribute("eval.correctness_score", 0.85).
Production traffic is your best source for building eval datasets. Sample the cases where automated evals flagged low quality, have a human reviewer verify and label them, and add them to your regression test suite. Every production failure becomes a permanent quality gate.
---
Implementing LLM Observability — Step by Step
The most common mistake teams make is waiting until they have a clear observability strategy before instrumentation. Don't. Start with auto-instrumentation today, add dashboards this week, and layer in evals over the following weeks. Observability compounds — every day without it is data you'll never recover.
This three-stage rollout is designed to get you value immediately while building toward a complete system.
Stage 1 — Instrument Your Application (Day 1)
Install the Langfuse SDK and configure it with your project credentials. Its drop-in OpenAI client wrapper handles tracer initialization automatically:
"""
LLM Observability: Langfuse SDK Instrumentation Setup (Python)
==============================================================
Fastest path to production tracing — works with any LLM provider.

Requirements:
    pip install langfuse openai

Environment variables:
    LANGFUSE_PUBLIC_KEY  – your Langfuse project public key
    LANGFUSE_SECRET_KEY  – your Langfuse project secret key
    LANGFUSE_HOST        – https://cloud.langfuse.com (or self-hosted URL)
"""

import os
from langfuse import Langfuse
from langfuse.openai import openai   # Drop-in OpenAI client with auto-tracing
from langfuse.decorators import observe, langfuse_context

langfuse = Langfuse()   # Reads LANGFUSE_PUBLIC_KEY, SECRET_KEY, HOST from env
langfuse.auth_check()   # Verify connectivity during setup

# Drop-in replacement — identical API, fully auto-traced
client = openai.OpenAI()

@observe(name="rag-chatbot")
def handle_user_request(user_message: str, session_id: str) -> str:
    # Attach version metadata — required for attributing changes to deployments
    langfuse_context.update_current_trace(
        session_id=session_id,
        metadata={
            "prompt_template_version": os.getenv("PROMPT_VERSION", "v2.3"),
            "model_version": "gpt-4o-2024-11-20",
            "app_version": os.getenv("APP_VERSION", "1.0.0"),
        },
    )
    context_chunks = retrieve_context(user_message)
    return generate_answer(user_message, context_chunks)

@observe(name="retrieve-context")
def retrieve_context(query: str) -> list[str]:
    client.embeddings.create(model="text-embedding-3-small", input=query)
    return [f"Retrieved context chunk {i}" for i in range(4)]  # Stub

@observe(name="generate-answer")
def generate_answer(user_message: str, context: list[str]) -> str:
    # Auto-captures: model, input_tokens, output_tokens, finish_reason, cost
    response = client.chat.completions.create(
        model="gpt-4o",
        messages=[
            {"role": "system", "content": f"Answer based only on context:\n{chr(10).join(context)}"},
            {"role": "user", "content": user_message},
        ],
        max_tokens=512, temperature=0.2,
    )
    return response.choices[0].message.content

# Attach eval scores from your async eval worker
def score_trace(trace_id: str, correctness: float, groundedness: float) -> None:
    langfuse.score(trace_id=trace_id, name="correctness", value=correctness)
    langfuse.score(trace_id=trace_id, name="groundedness", value=groundedness)
    langfuse.score(trace_id=trace_id, name="quality_score",
                   value=round(correctness * 0.6 + groundedness * 0.4, 3))

if __name__ == "__main__":
    result = handle_user_request("What LLM metrics should I track?", "test-001")
    langfuse.flush()  # Flush spans before process exit
    print("✓ Check your Langfuse dashboard.")
The minimal required configuration: set LANGFUSE_PUBLIC_KEY, LANGFUSE_SECRET_KEY, and LANGFUSE_HOST. The @observe decorator creates a root trace for each function call, with nested child spans for every decorated function inside it. For the full OpenTelemetry pipeline — manual span creation, custom attributes, and direct OTLP export — see the complete OTel + OpenLLMetry example in the Distributed Tracing section above.
Verify by triggering a test request and checking the trace in your backend UI. You should see the LLM span with gen_ai.usage.input_tokens, gen_ai.usage.output_tokens, gen_ai.response.finish_reason, and the total latency. That's your baseline.
Stage 2 — Build Your Metrics Dashboard (Week 1)
With tracing in place, your backend is accumulating the raw data. Now surface it.
Priority metrics for your first dashboard:
- P50/P95/P99 TTFT — broken down by model and endpoint
- Total request latency — same breakdowns
- Error rate — by error type (timeout, rate limit, context length exceeded)
- Token usage per endpoint — input and output separately
- Estimated cost per request — most backends compute this automatically from the model name
Build breakdowns by model version, prompt template version, and user segment. These dimensions are what transform metrics from "something is wrong" to "this specific configuration in this specific context is wrong."
Spend the first week establishing baseline values — a "golden week" of normal traffic. These baselines become the denominators for your alerting thresholds. You cannot set meaningful alert thresholds for LLM quality metrics without knowing what normal looks like.
Stage 3 — Add Evaluation Coverage (Weeks 2–4)
Start with one heuristic eval on your most critical user-facing flow. Pick the simplest check that would catch a real failure: JSON schema validation if your application returns structured data, response length bounds if brevity is important, or a forbidden-phrase list if safety is a concern.
Once that's running and connected to your trace store, add one LLM-as-judge eval for the same flow. Use a fast, low-cost model as the judge — GPT-4o mini or Claude Haiku work well. Connect the scores back to traces using your platform's score() API or OTel custom attributes.
With even one heuristic and one judge eval running, you have a quality feedback loop. Now you can answer questions like: "Did the prompt change we shipped last Tuesday improve quality?"
Version Tracking Is Non-Negotiable
Every trace must be tagged with three version identifiers: prompt_template_version, model_version, and app_version. Without these tags, you cannot attribute quality or cost changes to specific deployments. You're debugging in the dark.
Treat prompt versions exactly like code versions. Store prompt templates in version control. Tag every deployment with the prompt version it uses. Require eval scores to meet a minimum threshold before promoting a prompt change — this is prompt engineering best practices applied to production operations.
Deployment Patterns
Cloud-managed platforms (LangSmith, Langfuse Cloud) are the fastest path to a complete setup. Zero infrastructure to operate, built-in dashboards, and eval workflows out of the box. The trade-off is data residency — your prompt and response data lives in the vendor's cloud.
Self-hosted options (Langfuse on Docker Compose or Kubernetes, Arize Phoenix local) give you full data control. Required for regulated industries, healthcare, finance, or any application where prompt/response data cannot leave your environment.
Full OTel pipeline (OTel Collector → ClickHouse or Postgres → Grafana) gives you maximum flexibility and lowest vendor lock-in. It's also the highest operational burden — you own the storage, indexing, and dashboard configuration. Best for teams with strong platform engineering capacity who need deep customization.
---
LLM Observability Tools Compared
The tooling landscape splits into three broad categories: LLM-native platforms built specifically for language model observability, general APM platforms with LLM extensions bolted on, and open-source or self-hosted options. Choosing the right tool is less about features and more about fit — your existing stack, your data privacy requirements, and how mature your LLM operations practice is.
The Major Tools
LangSmith (by LangChain) has the tightest integration with the LangChain and LangGraph ecosystems. If your application is built on LangChain, LangSmith's automatic instrumentation is essentially zero-config. Dataset management and eval workflows are well-developed. The limitations: it's cloud-only, pricing scales with trace volume, and it offers less value for teams not using LangChain.
Langfuse is the most versatile option for most teams. The core is fully open-source, with cloud and self-hosted deployment options. It's genuinely framework-agnostic — works equally well with raw OpenAI SDK calls, LangChain, LlamaIndex, or custom pipelines. Built-in prompt management, OpenTelemetry-native ingestion, and a strong eval SDK make it the best balance of features and flexibility. For teams with data privacy requirements, the self-hosted option is a first-class path, not an afterthought.
Arize Phoenix stands out for its eval framework. The open-source arize-phoenix library ships a comprehensive set of pre-built evaluators — hallucination detection, RAG groundedness, Q&A correctness — that can be run locally in a notebook or deployed to a cluster. It's OTel-compatible and can export traces to any standard backend. Best for teams doing heavy eval development or running intensive offline evaluation workflows.
Helicone takes a proxy-based approach: route your LLM API calls through Helicone's proxy, and you get automatic logging, cost tracking, and rate limiting with zero application code changes. This is the right choice for rapid cost visibility on existing applications, but the eval capabilities are more limited than LangSmith or Langfuse.
W&B Weave integrates deeply with the Weights & Biases ML platform. If your team already uses W&B for experiment tracking, model training, and dataset management, Weave adds LLM observability into the same workflow. Eval and dataset management are strong. Less valuable if you're not already in the W&B ecosystem.
OpenLit is fully open-source, OTel-native, and self-hostable with minimal dependencies. Feature set is intentionally minimal — it instruments, it exports, it dashboards. The right choice for compliance-heavy environments where any proprietary tooling is off the table and operational simplicity matters more than features.
| Feature | LangSmith | Langfuse | Arize Phoenix | Helicone | W&B Weave | OpenLit |
|---|---|---|---|---|---|---|
| Deployment | Cloud only | Cloud + self-hosted | Cloud + local | Cloud only | Cloud only | Self-hosted only |
| Open Source | ❌ | ✅ Core OSS | ✅ Fully OSS | ❌ | ❌ | ✅ Fully OSS |
| Framework Support | LangChain / LangGraph (native); others via SDK | Framework-agnostic | Framework-agnostic | Any (proxy) | Framework-agnostic | Framework-agnostic |
| Instrumentation Method | SDK / auto-patch | SDK + OTel native | SDK + OTel native | Proxy (zero-code-change) | SDK | OTel native |
| Distributed Tracing | ✅ Full chain | ✅ Full chain | ✅ Full chain | ✅ Request-level | ✅ Full chain | ✅ Full chain |
| Eval Framework | ✅ Strong | ✅ Strong | ✅ Best-in-class OSS | ⚠️ Basic | ✅ Strong | ⚠️ Minimal |
| Prompt Management | ✅ | ✅ | ❌ | ❌ | ⚠️ Basic | ❌ |
| Cost Tracking | ✅ Auto-computed | ✅ Auto-computed | ✅ | ✅ (primary feature) | ✅ | ✅ |
| Data Privacy / Self-host | ❌ Cloud only | ✅ Full self-host | ✅ Local / cluster | ❌ Cloud only | ❌ Cloud only | ✅ Full self-host |
| Free Tier | 5K traces/mo | 50K observations/mo | Unlimited (local) | 10K requests/mo | Varies | Unlimited (self-hosted) |
| Best For | LangChain shops | Most teams (versatile) | Eval-heavy teams | Rapid cost visibility | W&B ML platform users | Compliance-heavy envs |
✅ Full support · ⚠️ Partial / limited · ❌ Not supported
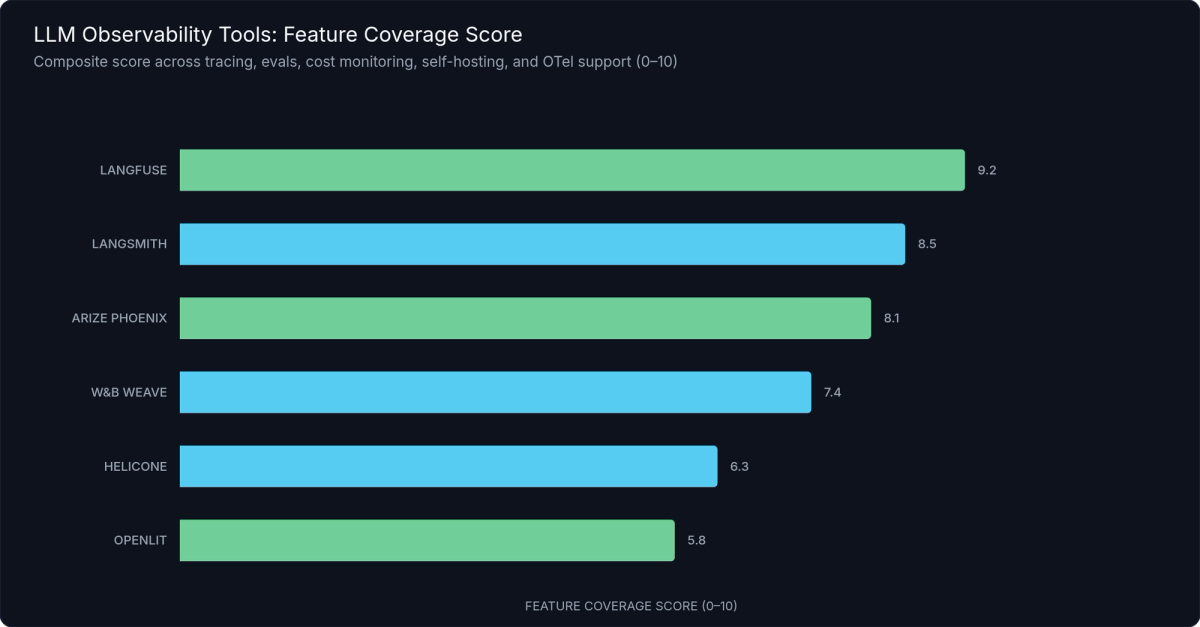
Figure 4: LLM Observability Tool Feature Coverage — Langfuse leads in deployment flexibility and framework agnosticism; LangSmith and Arize Phoenix lead in eval framework depth; Helicone excels at cost tracking with zero-code instrumentation.
How to Choose
Building on LangChain or LangGraph? Start with LangSmith. Switch to Langfuse if self-hosting becomes a requirement.
Data privacy or compliance requirement? Langfuse self-hosted or OpenLit — both give you full data control with zero phone-home behavior.
Need immediate cost visibility without touching code? Helicone proxy is the fastest path, often operational in under 15 minutes.
Already on W&B for ML work? W&B Weave keeps your observability and training workflows unified.
Doing heavy eval development? Arize Phoenix's eval library is the most comprehensive pre-built option.
Already invested in Datadog or New Relic? Use their LLM extensions for operational metrics, and add Langfuse specifically for eval depth — the two complement each other.
Inference Provider Observability
The observability stack doesn't start at your application layer. Your inference provider is where latency and cost originate, and providers that surface per-request token usage and latency data reduce the tooling burden at the application layer.
Providers like Fireworks AI, Together AI, and Groq expose this data via their APIs. For teams running open-source model inference at scale, inference.net provides per-request token usage, latency, and cost visibility natively — reducing the need for separate cost-monitoring tooling and offering competitive pricing that makes token-level cost attribution more actionable.
---
Cost Monitoring and Token Optimization
LLM API costs don't scale linearly with users — they scale with tokens, and token counts are often non-linear with request complexity. A single conversation that spans 20 turns with long assistant responses can consume 50× the tokens of a one-shot query. Three patterns drive most unexpected cost growth: long conversation histories (context window accumulation), verbose system prompts repeated on every call, and retrieval that dumps too much context into the prompt window.
Token Cost Attribution
The foundation of cost control is attribution: knowing which endpoint, feature, user segment, or prompt template is responsible for which token spend. Track input_tokens and output_tokens per request, per endpoint, per user — and map them to dollar cost using provider pricing.
Current reference prices (verify against provider pricing pages before budgeting — rates change frequently): GPT-4o at $2.50/1M input tokens and $10/1M output tokens; Claude 3.5 Sonnet at $3/1M input and $15/1M output. Open-source models served via providers like inference.net run at a fraction of these costs — the LLM cost optimization benefit of open-source inference is only actionable if you're tracking costs at this granularity.
Most observability platforms automatically compute estimated cost if you supply the model name in span attributes. Validate that their pricing tables are current — model pricing changes frequently, and stale tables understate actual spend.
Cost Anomaly Detection
Set per-request cost budgets appropriate to your application. If a single chat request costs more than $0.10 (or whatever your application-specific ceiling is), log it, flag it for review, and alert if it's a sustained pattern rather than a one-off.
Monitor cost-per-user-session to catch runaway conversation loops — a user in an infinite retry loop or a poorly designed agentic workflow can accumulate enormous context windows and corresponding costs before any throughput metric shows an anomaly.
Critically, look at p95 and p99 token counts, not just median. The median request might be perfectly efficient. The outliers — long conversations, complex agents, bad retrieval results that force verbose responses — are where costs concentrate. Median alone makes your cost profile look better than it is.
Prompt Efficiency via Observability Data
Your trace store is a map of where tokens go. Use it.
Sort your traces by token cost to identify the most expensive prompts and flows. Then measure the ROI of compression: shorten the system prompt by 400 tokens, run an eval comparison, and ship the compression if quality impact is less than your acceptable threshold. This isn't guesswork — it's a controlled experiment with measurable outcomes.
Semantic caching is the highest-ROI cost reduction tactic for many applications. When users ask similar questions with different phrasing, a semantic cache returns the stored response instead of calling the model again. Track cache hit rate as a dashboard metric; a hit rate below 20% for queries that should be semantically similar means your cache key configuration needs tuning.
Model Routing
Observability data enables intelligent model routing. If you can classify incoming requests by complexity — simple factual queries vs. multi-step reasoning tasks — you can route easy queries to smaller, cheaper models and reserve your most capable (and expensive) model for requests that genuinely need it.
Platforms like Langfuse and LangSmith support A/B experiment tracking across model versions. Use this to validate cost-quality trade-offs: route 10% of traffic to the cheaper model, compare eval scores, and promote the routing policy if quality impact is within acceptable bounds. Teams applying this pattern typically report 40–60% cost reductions with minimal measurable quality impact — results vary by use case and how aggressively routing rules are tuned.
---
Production Best Practices — Alerts, Dashboards, and Incident Response
Observability data is only useful if it drives action. The best-instrumented LLM application in the world still fails silently if no one is alerted when something goes wrong, and if no runbook exists for what to do when they are.
Alert Taxonomy
LLM systems need three tiers of alerts, each with different response requirements.
Tier 1 — Page immediately:
- Error rate exceeds 5% for more than 5 consecutive minutes
- P99 TTFT exceeds 60 seconds
- Safety eval triggers — harmful content detected in any sampled response
- Eval scores drop more than 25% below baseline in a 15-minute window
Tier 2 — Slack notification, respond within an hour:
- Cost-per-request exceeds 2× the daily baseline
- Quality score drops more than 10% vs. rolling 7-day average
- Token quota approaching provider limit (> 80% consumed)
- Specific prompt template version producing measurably lower quality
Tier 3 — Daily digest or ticket:
- Retrieval latency trending upward over 7 days (early signal of index degradation)
- New user segments showing unusual request patterns
- Prompt template A/B experiment reaching statistical significance (action: review and decide)
- Token cost per user-session trending above baseline (early signal of context accumulation)
Dashboard Structure
The on-call engineer opening your LLM observability dashboard at 3am needs to answer one question in under 10 seconds: "Is everything OK right now?" Structure your dashboard to answer that first, then provide depth.
Top row — Current status: Error rate, P95 latency, cost per hour. Green/yellow/red health indicators. This row answers the immediate question.
Second row — Quality trends: Eval scores by flow over the last 24 hours, user feedback rate, refusal rate. This row catches quality degradation that operational metrics miss.
Third row — Cost and volume: Requests per minute, tokens per minute, cost per hour vs. daily budget. This row catches cost anomalies before they compound.
Bottom — Deployment metadata: Currently live prompt template versions, model versions, app versions, and when each was deployed. This row is what you check first when a quality or cost anomaly started at a specific time — it usually corresponds to a deployment.
Incident Response Runbook
LLM incidents don't fit the standard "find the error, fix the error, deploy the fix" pattern. The failure is often in data or configuration, not code. Adapt your runbook accordingly:
- Identify: Which metric or eval triggered? (Latency? Error rate? Quality score? Cost?)
- Scope: Which model, prompt version, endpoint, and user segment is affected? Is this isolated or broad?
- Isolate: Pull traces from the affected window. Find the failing request pattern — what do the bad requests have in common? Long context? Specific user segment? Recent deployment?
- Remediate: Roll back the prompt template version using feature flags. Switch to a backup model. Disable the affected feature. Apply a rate limit on the problematic pattern.
- Validate: Confirm eval scores recover. Confirm the alert clears. Monitor for 15 minutes before declaring resolved.
- Post-mortem: Add the failure pattern as a regression eval. Every production incident that's not converted into a permanent quality gate will recur.
Change Management for LLM Systems
Treat prompt changes with the same rigor as code changes. Store prompt templates in version control. Use staged rollout: 1% of traffic → 10% → 50% → 100%, with eval gates at each stage. A prompt change that degrades eval scores at the 1% stage should not proceed.
Capture before/after eval scores in the deployment record. This is your audit trail — if something goes wrong six weeks later, you want to be able to trace quality regression to a specific prompt change.
This isn't bureaucracy. It's the minimum viable change control for a system where a one-line prompt edit can meaningfully change user experience for every user of your application.
---
Frequently Asked Questions
What is the difference between LLM observability and LLM monitoring?
Monitoring is the practice of collecting metrics and triggering alerts — it's reactive. Observability is the ability to understand why a system behaves a certain way from its external outputs — it's exploratory and proactive. LLM observability subsumes monitoring and adds tracing, structured log analysis, and automated evals. In practice, the terms are often used interchangeably, but the distinction matters: monitoring tells you something is wrong; observability tells you why.
How do I measure LLM output quality in production?
Use three approaches in combination: heuristic checks (format validation, forbidden phrases, structural validation) running on 100% of traffic for broad coverage; LLM-as-judge evals on a 5–20% sample for semantic quality scoring across dimensions like correctness and groundedness; and user feedback signals (thumbs up/down, retry rate) as real-time leading indicators. Attach all scores to the original trace spans so you can correlate quality with request characteristics.
What is time to first token (TTFT) and why does it matter?
TTFT is the elapsed time from sending a request until the first token of the response arrives. It determines perceived responsiveness in streaming interfaces — the moment users see text begin to appear. For chat applications, TTFT under 1 second is the target for acceptable UX. TTFT is often dominated by request queuing, KV-cache miss latency at the inference layer, and prompt processing time — not generation speed.
How do I instrument LLM calls without changing my application code?
Use either a proxy-based approach (Helicone, or LiteLLM proxy with OTel enabled) or auto-instrumentation via OpenLLMetry. The proxy approach requires only an endpoint change — point your LLM SDK at the proxy URL instead of the provider directly. OpenLLMetry requires only SDK initialization at application startup. Neither approach requires modifying your existing LLM call sites, making both options good choices for rapid instrumentation of existing codebases.
How much does LLM observability tooling cost?
Langfuse open-source is free when self-hosted; the cloud free tier covers 50,000 observations per month. LangSmith's Developer tier is free up to 5,000 traces per month, then $0.005–$0.05 per trace at higher volumes. Arize Phoenix is free for local use. OpenLit is fully free and open-source. General APM platforms (Datadog, New Relic) charge based on host and custom metric counts, which can become expensive at high trace volumes if you're tracking many LLM-specific dimensions.
---
Start Before You're Ready
The four-pillar framework — Metrics → Traces → Logs → Evals — is the complete picture of what LLM observability requires. Each pillar answers a different question. Together, they give you the ability to know when something is wrong, why it's wrong, what the model was doing when it went wrong, and whether the output was ever good to begin with.
The compounding value of LLM observability starts on day one. Teams that instrument early build a feedback loop: each production issue gets converted into a regression eval, eval scores improve over deployment cycles, costs are tracked and optimized against a clear baseline, and the next incident is both easier to diagnose and less likely to recur. Teams that wait instrument reactively after a major failure — without the historical data to understand what changed.
The practical next steps are smaller than they seem:
- This week: Add auto-instrumentation to your LLM application. OpenLLMetry setup takes under 30 minutes for any application using a major LLM SDK.
- Next week: Define your first heuristic eval on your most critical user-facing flow. Pick the simplest check that would catch a real failure.
- This month: Define your Tier 1 alert — the condition that would wake you up at 3am. Set it. Test it. Trust it.
For teams running open-source models at scale, the inference layer is where cost and latency originate. Inference.net provides per-request token usage, latency, and cost data natively, paired with competitive pricing on open-source models — reducing the tooling overhead for teams that need both visibility and cost control in the same place.
---
References
- OpenTelemetry GenAI Semantic Conventions — https://opentelemetry.io/docs/specs/semconv/gen-ai/
- OpenLLMetry (Traceloop) Documentation — https://www.traceloop.com/docs/openllmetry
- OpenInference Specification (Arize) — https://arize-ai.github.io/openinference/
- Langfuse Documentation — https://langfuse.com/docs
- LangSmith Documentation — https://docs.smith.langchain.com/
- Arize Phoenix Documentation — https://docs.arize.com/phoenix
- Helicone Documentation — https://docs.helicone.ai/
- W&B Weave Documentation — https://weave-docs.wandb.ai/
- OpenLit GitHub Repository — https://github.com/openlit/openlit
- RAGAS: Evaluation Framework for RAG Pipelines — https://docs.ragas.io/
- Zheng et al. (2023), "Judging LLM-as-a-Judge with MT-Bench and Chatbot Arena" — https://arxiv.org/abs/2306.05685
- OpenAI API Pricing — https://openai.com/pricing
- Anthropic API Pricing — https://www.anthropic.com/pricing
- Google SRE Book — https://sre.google/sre-book/table-of-contents/
Meet with our research team
Schedule a call with our research team to learn more Specialized Language Models can cut costs and improve performance.