'%3e%3crect%20x='2'%20y='1.64014'%20width='48'%20height='48'%20rx='24'%20fill='%23292929'/%3e%3crect%20x='2.625'%20y='2.26514'%20width='46.75'%20height='46.75'%20rx='23.375'%20stroke='%23636363'%20stroke-width='1.25'/%3e%3cpath%20d='M22.6665%2025.6402L24.8887%2027.8624L29.8887%2022.8624M20.8151%2016.5498C21.7082%2016.4786%2022.5561%2016.1273%2023.2381%2015.5462C24.8295%2014.19%2027.1701%2014.19%2028.7615%2015.5462C29.4434%2016.1273%2030.2913%2016.4786%2031.1845%2016.5498C33.2687%2016.7162%2034.9238%2018.3712%2035.0901%2020.4555C35.1614%2021.3486%2035.5126%2022.1965%2036.0938%2022.8785C37.4499%2024.4699%2037.4499%2026.8105%2036.0938%2028.4019C35.5126%2029.0838%2035.1614%2029.9317%2035.0901%2030.8249C34.9238%2032.9091%2033.2687%2034.5642%2031.1845%2034.7305C30.2913%2034.8018%2029.4434%2035.153%2028.7615%2035.7341C27.1701%2037.0903%2024.8295%2037.0903%2023.2381%2035.7341C22.5561%2035.153%2021.7082%2034.8018%2020.8151%2034.7305C18.7308%2034.5642%2017.0758%2032.9091%2016.9094%2030.8249C16.8382%2029.9317%2016.487%2029.0838%2015.9058%2028.4019C14.5496%2026.8105%2014.5496%2024.4699%2015.9058%2022.8785C16.487%2022.1965%2016.8382%2021.3486%2016.9094%2020.4555C17.0758%2018.3712%2018.7308%2016.7161%2020.8151%2016.5498Z'%20stroke='%23E7E7E7'%20stroke-width='1.125'%20stroke-linecap='round'%20stroke-linejoin='round'/%3e%3c/g%3e%3cdefs%3e%3cfilter%20id='filter0_d_411_10857'%20x='0.5'%20y='0.140137'%20width='51'%20height='51'%20filterUnits='userSpaceOnUse'%20color-interpolation-filters='sRGB'%3e%3cfeFlood%20flood-opacity='0'%20result='BackgroundImageFix'/%3e%3cfeColorMatrix%20in='SourceAlpha'%20type='matrix'%20values='0%200%200%200%200%200%200%200%200%200%200%200%200%200%200%200%200%200%20127%200'%20result='hardAlpha'/%3e%3cfeMorphology%20radius='1.5'%20operator='dilate'%20in='SourceAlpha'%20result='effect1_dropShadow_411_10857'/%3e%3cfeOffset/%3e%3cfeComposite%20in2='hardAlpha'%20operator='out'/%3e%3cfeColorMatrix%20type='matrix'%20values='0%200%200%200%200.08%200%200%200%200%200.08%200%200%200%200%200.08%200%200%200%201%200'/%3e%3cfeBlend%20mode='normal'%20in2='BackgroundImageFix'%20result='effect1_dropShadow_411_10857'/%3e%3cfeBlend%20mode='normal'%20in='SourceGraphic'%20in2='effect1_dropShadow_411_10857'%20result='shape'/%3e%3c/filter%3e%3c/defs%3e%3c/svg%3e)
'%3e%3crect%20x='2'%20y='1.64014'%20width='48'%20height='48'%20rx='24'%20fill='%23292929'/%3e%3crect%20x='2.625'%20y='2.26514'%20width='46.75'%20height='46.75'%20rx='23.375'%20stroke='%23636363'%20stroke-width='1.25'/%3e%3cpath%20d='M21.5556%2015.6401H19.5556C18.311%2015.6401%2017.6887%2015.6401%2017.2134%2015.8823C16.7952%2016.0954%2016.4553%2016.4354%2016.2422%2016.8535C16%2017.3289%2016%2017.9511%2016%2019.1957V21.1957M21.5556%2035.6401H19.5556C18.311%2035.6401%2017.6887%2035.6401%2017.2134%2035.3979C16.7952%2035.1849%2016.4553%2034.8449%2016.2422%2034.4268C16%2033.9514%2016%2033.3291%2016%2032.0846V30.0846M36%2021.1957V19.1957C36%2017.9511%2036%2017.3289%2035.7578%2016.8535C35.5447%2016.4354%2035.2048%2016.0954%2034.7866%2015.8823C34.3113%2015.6401%2033.689%2015.6401%2032.4444%2015.6401H30.4444M36%2030.0846V32.0846C36%2033.3291%2036%2033.9514%2035.7578%2034.4268C35.5447%2034.8449%2035.2048%2035.1849%2034.7866%2035.3979C34.3113%2035.6401%2033.689%2035.6401%2032.4444%2035.6401H30.4444M30.4444%2025.6401C30.4444%2028.0947%2028.4546%2030.0846%2026%2030.0846C23.5454%2030.0846%2021.5556%2028.0947%2021.5556%2025.6401C21.5556%2023.1855%2023.5454%2021.1957%2026%2021.1957C28.4546%2021.1957%2030.4444%2023.1855%2030.4444%2025.6401Z'%20stroke='%23E7E7E7'%20stroke-width='1.125'%20stroke-linecap='round'%20stroke-linejoin='round'/%3e%3c/g%3e%3cdefs%3e%3cfilter%20id='filter0_d_1154_2040'%20x='0.5'%20y='0.140137'%20width='51'%20height='51'%20filterUnits='userSpaceOnUse'%20color-interpolation-filters='sRGB'%3e%3cfeFlood%20flood-opacity='0'%20result='BackgroundImageFix'/%3e%3cfeColorMatrix%20in='SourceAlpha'%20type='matrix'%20values='0%200%200%200%200%200%200%200%200%200%200%200%200%200%200%200%200%200%20127%200'%20result='hardAlpha'/%3e%3cfeMorphology%20radius='1.5'%20operator='dilate'%20in='SourceAlpha'%20result='effect1_dropShadow_1154_2040'/%3e%3cfeOffset/%3e%3cfeComposite%20in2='hardAlpha'%20operator='out'/%3e%3cfeColorMatrix%20type='matrix'%20values='0%200%200%200%200.08%200%200%200%200%200.08%200%200%200%200%200.08%200%200%200%201%200'/%3e%3cfeBlend%20mode='normal'%20in2='BackgroundImageFix'%20result='effect1_dropShadow_1154_2040'/%3e%3cfeBlend%20mode='normal'%20in='SourceGraphic'%20in2='effect1_dropShadow_1154_2040'%20result='shape'/%3e%3c/filter%3e%3c/defs%3e%3c/svg%3e)
'%3e%3crect%20x='2'%20y='1.64014'%20width='48'%20height='48'%20rx='24'%20fill='%23292929'/%3e%3crect%20x='2.625'%20y='2.26514'%20width='46.75'%20height='46.75'%20rx='23.375'%20stroke='%23636363'%20stroke-width='1.25'/%3e%3cpath%20d='M23.7778%2031.9275V34.5291C23.7778%2035.7564%2024.7727%2036.7513%2026%2036.7513C27.2273%2036.7513%2028.2222%2035.7564%2028.2222%2034.5291V31.9275M26%2014.5291V15.6402M16%2025.6402H14.8889M18.7778%2018.4179L18.111%2017.7512M33.2222%2018.4179L33.8892%2017.7512M37.1111%2025.6402H36M32.6667%2025.6402C32.6667%2029.3221%2029.6819%2032.3068%2026%2032.3068C22.3181%2032.3068%2019.3333%2029.3221%2019.3333%2025.6402C19.3333%2021.9583%2022.3181%2018.9735%2026%2018.9735C29.6819%2018.9735%2032.6667%2021.9583%2032.6667%2025.6402Z'%20stroke='%23E7E7E7'%20stroke-width='1.125'%20stroke-linecap='round'%20stroke-linejoin='round'/%3e%3c/g%3e%3cdefs%3e%3cfilter%20id='filter0_d_1117_17437'%20x='0.5'%20y='0.140137'%20width='51'%20height='51'%20filterUnits='userSpaceOnUse'%20color-interpolation-filters='sRGB'%3e%3cfeFlood%20flood-opacity='0'%20result='BackgroundImageFix'/%3e%3cfeColorMatrix%20in='SourceAlpha'%20type='matrix'%20values='0%200%200%200%200%200%200%200%200%200%200%200%200%200%200%200%200%200%20127%200'%20result='hardAlpha'/%3e%3cfeMorphology%20radius='1.5'%20operator='dilate'%20in='SourceAlpha'%20result='effect1_dropShadow_1117_17437'/%3e%3cfeOffset/%3e%3cfeComposite%20in2='hardAlpha'%20operator='out'/%3e%3cfeColorMatrix%20type='matrix'%20values='0%200%200%200%200.08%200%200%200%200%200.08%200%200%200%200%200.08%200%200%200%201%200'/%3e%3cfeBlend%20mode='normal'%20in2='BackgroundImageFix'%20result='effect1_dropShadow_1117_17437'/%3e%3cfeBlend%20mode='normal'%20in='SourceGraphic'%20in2='effect1_dropShadow_1117_17437'%20result='shape'/%3e%3c/filter%3e%3c/defs%3e%3c/svg%3e)
'%3e%3crect%20x='2.33301'%20y='2'%20width='48'%20height='48'%20rx='24'%20fill='%23292929'/%3e%3crect%20x='2.95801'%20y='2.625'%20width='46.75'%20height='46.75'%20rx='23.375'%20stroke='%23636363'%20stroke-width='1.25'/%3e%3cpath%20d='M18.5557%2022.6665H34.1112M18.5557%2029.3332H34.1112'%20stroke='%23E7E7E7'%20stroke-width='1.125'%20stroke-linecap='round'%20stroke-linejoin='round'/%3e%3c/g%3e%3cdefs%3e%3cfilter%20id='filter0_d_1851_59239'%20x='0.833008'%20y='0.5'%20width='51'%20height='51'%20filterUnits='userSpaceOnUse'%20color-interpolation-filters='sRGB'%3e%3cfeFlood%20flood-opacity='0'%20result='BackgroundImageFix'/%3e%3cfeColorMatrix%20in='SourceAlpha'%20type='matrix'%20values='0%200%200%200%200%200%200%200%200%200%200%200%200%200%200%200%200%200%20127%200'%20result='hardAlpha'/%3e%3cfeMorphology%20radius='1.5'%20operator='dilate'%20in='SourceAlpha'%20result='effect1_dropShadow_1851_59239'/%3e%3cfeOffset/%3e%3cfeComposite%20in2='hardAlpha'%20operator='out'/%3e%3cfeColorMatrix%20type='matrix'%20values='0%200%200%200%200.08%200%200%200%200%200.08%200%200%200%200%200.08%200%200%200%201%200'/%3e%3cfeBlend%20mode='normal'%20in2='BackgroundImageFix'%20result='effect1_dropShadow_1851_59239'/%3e%3cfeBlend%20mode='normal'%20in='SourceGraphic'%20in2='effect1_dropShadow_1851_59239'%20result='shape'/%3e%3c/filter%3e%3c/defs%3e%3c/svg%3e)
'%3e%3crect%20x='2'%20y='2.14014'%20width='48'%20height='48'%20rx='24'%20fill='%23292929'/%3e%3crect%20x='2.625'%20y='2.76514'%20width='46.75'%20height='46.75'%20rx='23.375'%20stroke='%23636363'%20stroke-width='1.25'/%3e%3cpath%20d='M22.6667%2015.0288V17.251M29.3333%2015.0288V17.251M22.6667%2035.0288V37.251M29.3333%2035.0288V37.251M34.8889%2022.8066H37.1111M34.8889%2028.3621H37.1111M14.8889%2022.8066H17.1111M14.8889%2028.3621H17.1111M22.4444%2035.0288H29.5556C31.4224%2035.0288%2032.3558%2035.0288%2033.0689%2034.6655C33.6961%2034.3459%2034.206%2033.836%2034.5256%2033.2088C34.8889%2032.4957%2034.8889%2031.5623%2034.8889%2029.6955V22.5844C34.8889%2020.7175%2034.8889%2019.7841%2034.5256%2019.0711C34.206%2018.4439%2033.6961%2017.9339%2033.0689%2017.6143C32.3558%2017.251%2031.4224%2017.251%2029.5556%2017.251H22.4444C20.5776%2017.251%2019.6442%2017.251%2018.9311%2017.6143C18.3039%2017.9339%2017.794%2018.4439%2017.4744%2019.0711C17.1111%2019.7841%2017.1111%2020.7175%2017.1111%2022.5844V29.6955C17.1111%2031.5623%2017.1111%2032.4957%2017.4744%2033.2088C17.794%2033.836%2018.3039%2034.3459%2018.9311%2034.6655C19.6442%2035.0288%2020.5776%2035.0288%2022.4444%2035.0288ZM24.4444%2029.4733H27.5556C28.1778%2029.4733%2028.489%2029.4733%2028.7267%2029.3522C28.9357%2029.2456%2029.1057%2029.0756%2029.2122%2028.8666C29.3333%2028.6289%2029.3333%2028.3178%2029.3333%2027.6955V24.5844C29.3333%2023.9621%2029.3333%2023.6509%2029.2122%2023.4133C29.1057%2023.2042%2028.9357%2023.0342%2028.7267%2022.9277C28.489%2022.8066%2028.1778%2022.8066%2027.5556%2022.8066H24.4444C23.8222%2022.8066%2023.511%2022.8066%2023.2733%2022.9277C23.0643%2023.0342%2022.8943%2023.2042%2022.7878%2023.4133C22.6667%2023.6509%2022.6667%2023.9621%2022.6667%2024.5844V27.6955C22.6667%2028.3178%2022.6667%2028.6289%2022.7878%2028.8666C22.8943%2029.0756%2023.0643%2029.2456%2023.2733%2029.3522C23.511%2029.4733%2023.8222%2029.4733%2024.4444%2029.4733Z'%20stroke='%23E7E7E7'%20stroke-width='1.125'%20stroke-linecap='round'%20stroke-linejoin='round'/%3e%3c/g%3e%3cdefs%3e%3cfilter%20id='filter0_d_1117_10655'%20x='0.5'%20y='0.640137'%20width='51'%20height='51'%20filterUnits='userSpaceOnUse'%20color-interpolation-filters='sRGB'%3e%3cfeFlood%20flood-opacity='0'%20result='BackgroundImageFix'/%3e%3cfeColorMatrix%20in='SourceAlpha'%20type='matrix'%20values='0%200%200%200%200%200%200%200%200%200%200%200%200%200%200%200%200%200%20127%200'%20result='hardAlpha'/%3e%3cfeMorphology%20radius='1.5'%20operator='dilate'%20in='SourceAlpha'%20result='effect1_dropShadow_1117_10655'/%3e%3cfeOffset/%3e%3cfeComposite%20in2='hardAlpha'%20operator='out'/%3e%3cfeColorMatrix%20type='matrix'%20values='0%200%200%200%200.08%200%200%200%200%200.08%200%200%200%200%200.08%200%200%200%201%200'/%3e%3cfeBlend%20mode='normal'%20in2='BackgroundImageFix'%20result='effect1_dropShadow_1117_10655'/%3e%3cfeBlend%20mode='normal'%20in='SourceGraphic'%20in2='effect1_dropShadow_1117_10655'%20result='shape'/%3e%3c/filter%3e%3c/defs%3e%3c/svg%3e)

'%3e%3crect%20x='1.66699'%20y='2'%20width='48'%20height='48'%20rx='24'%20fill='%23292929'/%3e%3crect%20x='2.29199'%20y='2.625'%20width='46.75'%20height='46.75'%20rx='23.375'%20stroke='%23636363'%20stroke-width='1.25'/%3e%3cpath%20d='M35.667%2032.6667L34.5557%2033.8823C33.9664%2034.5269%2033.1672%2034.8889%2032.3338%2034.8889C31.5004%2034.8889%2030.7012%2034.5269%2030.1119%2033.8823C29.5217%2033.2391%2028.7225%2032.8779%2027.8894%2032.8779C27.0563%2032.8779%2026.2571%2033.2391%2025.667%2033.8823M15.667%2034.8889H17.5276C18.0711%2034.8889%2018.3429%2034.8889%2018.5986%2034.8275C18.8254%2034.7731%2019.0422%2034.6833%2019.241%2034.5615C19.4652%2034.424%2019.6574%2034.2319%2020.0418%2033.8475L34.0004%2019.8889C34.9208%2018.9684%2034.9208%2017.4761%2034.0004%2016.5556C33.0799%2015.6351%2031.5875%2015.6351%2030.667%2016.5556L16.7084%2030.5142C16.3241%2030.8985%2016.1319%2031.0907%2015.9945%2031.315C15.8726%2031.5138%2015.7828%2031.7306%2015.7284%2031.9573C15.667%2032.213%2015.667%2032.4848%2015.667%2033.0284V34.8889Z'%20stroke='%23E7E7E7'%20stroke-width='1.125'%20stroke-linecap='round'%20stroke-linejoin='round'/%3e%3c/g%3e%3cdefs%3e%3cfilter%20id='filter0_d_1851_59244'%20x='0.166992'%20y='0.5'%20width='51'%20height='51'%20filterUnits='userSpaceOnUse'%20color-interpolation-filters='sRGB'%3e%3cfeFlood%20flood-opacity='0'%20result='BackgroundImageFix'/%3e%3cfeColorMatrix%20in='SourceAlpha'%20type='matrix'%20values='0%200%200%200%200%200%200%200%200%200%200%200%200%200%200%200%200%200%20127%200'%20result='hardAlpha'/%3e%3cfeMorphology%20radius='1.5'%20operator='dilate'%20in='SourceAlpha'%20result='effect1_dropShadow_1851_59244'/%3e%3cfeOffset/%3e%3cfeComposite%20in2='hardAlpha'%20operator='out'/%3e%3cfeColorMatrix%20type='matrix'%20values='0%200%200%200%200.08%200%200%200%200%200.08%200%200%200%200%200.08%200%200%200%201%200'/%3e%3cfeBlend%20mode='normal'%20in2='BackgroundImageFix'%20result='effect1_dropShadow_1851_59244'/%3e%3cfeBlend%20mode='normal'%20in='SourceGraphic'%20in2='effect1_dropShadow_1851_59244'%20result='shape'/%3e%3c/filter%3e%3c/defs%3e%3c/svg%3e)
'%3e%3crect%20x='2'%20y='1.64014'%20width='48'%20height='48'%20rx='24'%20fill='%23292929'/%3e%3crect%20x='2.625'%20y='2.26514'%20width='46.75'%20height='46.75'%20rx='23.375'%20stroke='%23636363'%20stroke-width='1.25'/%3e%3cpath%20d='M25.9998%2035.6401L25.8886%2035.4734C25.1168%2034.3156%2024.7309%2033.7368%2024.221%2033.3177C23.7696%2032.9467%2023.2495%2032.6684%2022.6905%2032.4986C22.059%2032.3068%2021.3632%2032.3068%2019.9718%2032.3068H18.4442C17.1997%2032.3068%2016.5774%2032.3068%2016.102%2032.0646C15.6839%2031.8515%2015.3439%2031.5116%2015.1309%2031.0934C14.8887%2030.6181%2014.8887%2029.9958%2014.8887%2028.7512V19.1957C14.8887%2017.9511%2014.8887%2017.3289%2015.1309%2016.8535C15.3439%2016.4354%2015.6839%2016.0954%2016.102%2015.8823C16.5774%2015.6401%2017.1997%2015.6401%2018.4442%2015.6401H18.8887C21.3778%2015.6401%2022.6224%2015.6401%2023.5731%2016.1246C24.4094%2016.5507%2025.0893%2017.2306%2025.5154%2018.0668C25.9998%2019.0176%2025.9998%2020.2621%2025.9998%2022.7512M25.9998%2035.6401V22.7512M25.9998%2035.6401L26.111%2035.4734C26.8828%2034.3156%2027.2687%2033.7368%2027.7786%2033.3177C28.2299%2032.9467%2028.75%2032.6684%2029.3091%2032.4986C29.9406%2032.3068%2030.6363%2032.3068%2032.0278%2032.3068H33.5553C34.7999%2032.3068%2035.4222%2032.3068%2035.8975%2032.0646C36.3157%2031.8515%2036.6556%2031.5116%2036.8687%2031.0934C37.1109%2030.6181%2037.1109%2029.9958%2037.1109%2028.7512V19.1957C37.1109%2017.9511%2037.1109%2017.3289%2036.8687%2016.8535C36.6556%2016.4354%2036.3157%2016.0954%2035.8975%2015.8823C35.4222%2015.6401%2034.7999%2015.6401%2033.5553%2015.6401H33.1109C30.6218%2015.6401%2029.3772%2015.6401%2028.4265%2016.1246C27.5902%2016.5507%2026.9103%2017.2306%2026.4842%2018.0668C25.9998%2019.0176%2025.9998%2020.2621%2025.9998%2022.7512'%20stroke='%23E7E7E7'%20stroke-width='1.125'%20stroke-linecap='round'%20stroke-linejoin='round'/%3e%3c/g%3e%3cdefs%3e%3cfilter%20id='filter0_d_1154_3945'%20x='0.5'%20y='0.140137'%20width='51'%20height='51'%20filterUnits='userSpaceOnUse'%20color-interpolation-filters='sRGB'%3e%3cfeFlood%20flood-opacity='0'%20result='BackgroundImageFix'/%3e%3cfeColorMatrix%20in='SourceAlpha'%20type='matrix'%20values='0%200%200%200%200%200%200%200%200%200%200%200%200%200%200%200%200%200%20127%200'%20result='hardAlpha'/%3e%3cfeMorphology%20radius='1.5'%20operator='dilate'%20in='SourceAlpha'%20result='effect1_dropShadow_1154_3945'/%3e%3cfeOffset/%3e%3cfeComposite%20in2='hardAlpha'%20operator='out'/%3e%3cfeColorMatrix%20type='matrix'%20values='0%200%200%200%200.08%200%200%200%200%200.08%200%200%200%200%200.08%200%200%200%201%200'/%3e%3cfeBlend%20mode='normal'%20in2='BackgroundImageFix'%20result='effect1_dropShadow_1154_3945'/%3e%3cfeBlend%20mode='normal'%20in='SourceGraphic'%20in2='effect1_dropShadow_1154_3945'%20result='shape'/%3e%3c/filter%3e%3c/defs%3e%3c/svg%3e)
May 27, 2025
What is Machine Learning Model Drift? Types, Causes and Fixes
Inference Research
Machine learning models are like children—they need consistent care and nurturing to grow up healthy and strong. When you deploy a model into production, it often performs fabulously, minimizing error and making accurate predictions. Over time, as data changes, the model can become confused, leading to poor performance and unreliable predictions. This phenomenon, known as machine learning model drift, can be devastating for businesses relying on accurate, real-time predictions to make critical decisions. The good news is that you can avoid the pitfalls of model drift with timely intervention. In this article, we'll explore the ins and outs of Machine Learning Model Drift, including its causes, types, and monitoring ML models in production to maintain consistently high-performing machine learning models.
One way to detect model drift early is by using AI inference APIs. These tools provide continuous monitoring of your model's performance, helping you identify any irregularities as soon as they occur so you can take action before the drift impacts your business.
What is Model Drift in Machine Learning and Why Does it Happen?

Machine learning models can learn, adapt, and improve. But they're not immune to wear and tear like traditional software systems. A recent MIT and Harvard study states that 91% of ML models degrade over time, deduced from experiments conducted on 128 model and dataset pairs.
Understanding Model Drift's Impact
Production-deployed machine learning models can degrade significantly over time due to data changes or become unreliable due to sudden shifts in real-world data and scenarios. This phenomenon is known as model drift, and it can pose a significant challenge for ML practitioners and businesses.
Why ML Models Degrade Over Time
Model drift, also called model decay, AI aging, or temporal degradation, refers to the degradation of machine learning model performance over time. This means that the model suddenly or gradually starts to provide predictions with lower accuracy compared to its performance during the training period. According to recent research, 91% of ML models suffer from model drift.
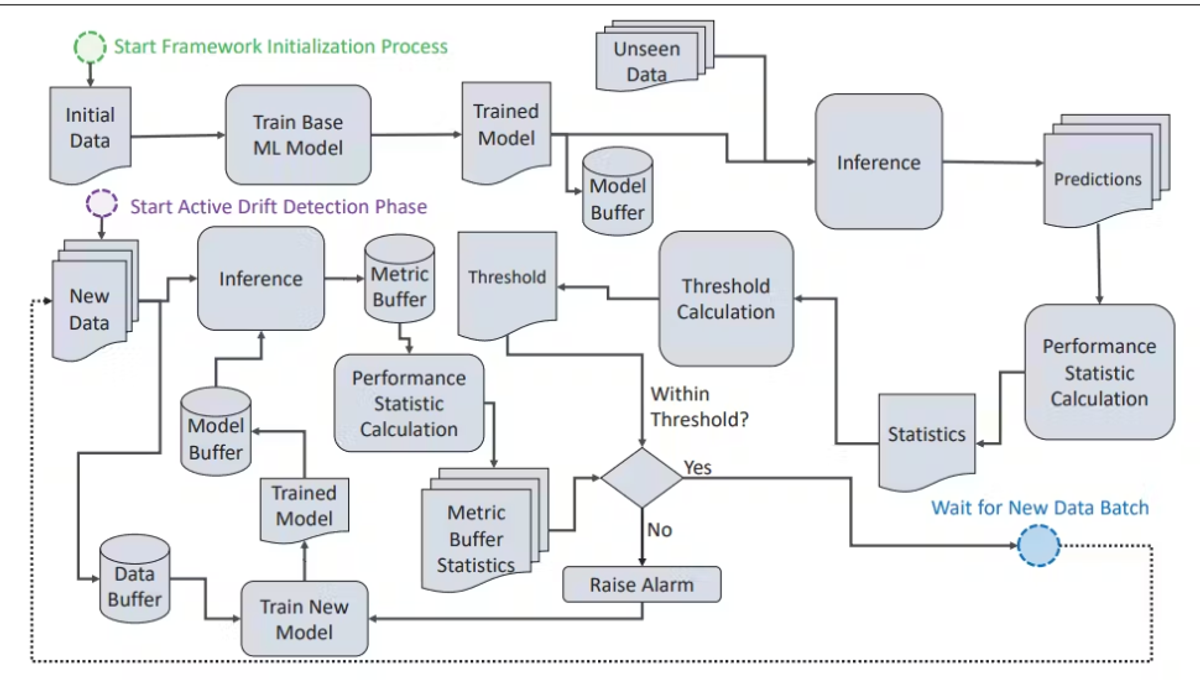
A Generalized Workflow of Model Drift Detection in Machine Learning
What Are the Types of Model Drift?
There are two main types of model drift:
Concept drift
Concept drift happens when the relationship between input variables (or independent variables) and the target variable (or dependent variable) changes. This means that the definition of what we are trying to predict changes, causing our algorithm to provide inaccurate predictions. Reasons for this can include latent features which are variables that have not been included in the model whose predictive value increases over time, rendering the model ineffective. This change can be gradual, sudden, or recurring:
Gradual concept drift
The change in fraudulent behavior is an example of gradual concept drift. As fraud detection methods become more sophisticated, fraudsters adapt to evade fraud detection systems by developing new strategies. An ML model trained on historical fraudulent transaction data would be unable to classify a new strategy as fraud. This means that the model's performance would degrade because the classification of what constitutes fraud has changed over time.
Sudden concept drift
Any sudden change in the environment can impact consumer behavior or global markets. For example, the 2021-2022 global chip shortage caused sudden concept drift, disrupting supply chain models that relied on stable conditions. These models failed to accurately predict new supply constraints and demand surges, resulting in operational challenges.
Despite the shortage, global semiconductor sales grew by 25% in 2021, underscoring the need for companies to quickly adapt their models and strategies to manage the unforeseen scarcity and supply chain issues.
Recurring concept drift
This is also called seasonality. For instance, retail sales increase significantly during the Christmas season or on Black Friday. An ML model that does not account for these known recurring trend changes would provide inaccurate predictions for these periods.
Data drift
Data drift occurs when the statistical properties of the input data change. For instance, as an online platform grows, its user base may shift in age distribution over time. Since the usage habits of young and old people are not the same, a model trained on young people’s usage data would provide inaccurate predictions for old people’s behavior.
- Gradual Concept Drift occurs when patterns in data slowly evolve over time. For instance, in fraud detection, criminals constantly adapt their methods, which degrades the model's accuracy. To address this, one should perform feature engineering and retrain the model regularly.
- Sudden Concept Drift happens when there’s an abrupt change in data distribution. An example is the rapid shift in consumer spending during COVID-19, which disrupted demand forecasts based on pre-pandemic data. In such cases, it’s essential to revisit the solution, potentially using a new algorithm, and evaluate whether the existing solution remains relevant.
- Sudden Concept Drift in Reality can also arise during emergencies, such as a sudden surge in a new respiratory illness. If a model hasn't been trained on similar events, it may fail to recognize the urgency, resulting in poor triage decisions. In these situations, it's crucial to shift to human intervention, retrain the model, and reevaluate the features used.
- Recurring Concept Drift refers to patterns that repeat over time, like holiday spikes in retail sales. A model that doesn’t factor in these seasonal trends may underperform. To correct this, retrain the model to incorporate seasonality and adjust it for these recurring patterns.
- Feature Data Drift occurs when new types of input data appear that weren’t present during training. For example, a sepsis prediction model might encounter new patient data formats or variables. This requires retraining the model on updated data and revisiting feature engineering strategies.
- Label Data Drift happens when the definition of a target variable changes. A financial model may misclassify credit risk if the meaning of “default” evolves. Corrective actions include retraining on the new labeled data and tuning the model accordingly.
- Feedback Data Drift arises when the model's outcomes influence future data in a biased way. For instance, a recommendation system might favor already popular items, reinforcing their selection and leading to skewed results. Evaluating the current solution’s efficacy and determining whether a new approach is needed are key steps.
- Prediction Drift occurs when external factors, like regulatory or market changes, affect model performance, particularly in financial models used for credit risk or trading. It’s important to analyze the impact of these changes on the business and adapt the models accordingly.
What Causes Model Drift?
Understanding the root cause of model drift in machine learning is crucial. Several factors contribute to model drift in ML models, such as:
Changes in the distribution of real-world data
When the distribution of the present data differs from that of the models’ training data. Since the models' training data contains outdated patterns, the model may not perform well on new data, reducing model accuracy.
Changes in consumer behavior
When the target audience's behavior changes over time, the model's predictions become less relevant. This can occur due to changes in trends, political decisions, climate change, media hype, etc. For example, if a recommendation system is not updated to account for frequently changing user preferences, the system will generate stale recommendations.
Model architecture
If a machine learning model is too complex, i.e., has many layers or connections, it can overfit small and unrepresentative training data and perform poorly on real-world data. On the other hand, if the model is too simple, i.e., it has few layers, it can underfit the training data and fail to capture the underlying patterns.
Data quality issues
Using inaccurate, incomplete, or noisy training data can adversely affect an ML model’s performance.
Adversarial attacks
Model drift can occur when a model is intentionally manipulated by malicious actors to alter the input data, resulting in incorrect predictions.
Model and code changes
New updates or modifications to the model’s codebase can introduce drift if not properly managed.
What are Some Real-World Examples of Model Drift?
Model drift deteriorates ML systems deployed across various industries.
Model Drift in Healthcare
Medical machine learning systems are mission-critical, making model drift a significantly dangerous issue. For example, consider an ML system trained for cervical cancer screening. If a new screening method, such as the HPV test, is introduced and integrated into clinical practice, the model must be updated accordingly; otherwise, its performance will deteriorate. In Berkman Sahiner and Weijie Chen's paper, titled "Data Drift in Medical Machine Learning: Implications and Potential Remedies," they demonstrate that data drift can be a significant contributor to performance deterioration in medical ML models.
They demonstrate that in the event of a concept shift leading to data drift, a full overhaul of the model is necessary, as even a minor change may not yield the desired results.
Model Drift in Finance
Banks use credit risk assessment models when giving out loans to their customers. Sometimes, changes in economic conditions, employment rates, or regulations can affect a customer’s ability to repay loans. If the model is not regularly updated with real-world data, it may fail to identify customers at higher risk of default, leading to increased loan defaults.Many financial institutions rely on machine learning (ML) models to make high-frequency trading decisions, and it is very common for market dynamics to change in split seconds.
Model Drift in Retail
Today, most retail companies rely on machine learning (ML) models and recommender systems. In fact, the global recommendation engine market is expected to grow from $5.17B in 2023 to $21.57B in 2028. Companies use these systems to determine product prices and suggest products to customers based on their:
- Past purchase history
- Browsing behavior
- Seasonality patterns
- Other factors
The Impact of Evolving Consumer Behavior
If there is a sudden change in consumer behavior, the model may fail to accurately forecast demand. For instance, a retail store wants to use an ML model to predict its customers' purchasing behavior for a new product. They have thoroughly trained and tested a model using historical customer data.
Before the product launch, a competitor introduces a similar product, or market dynamics are disrupted by external factors, such as global inflation. As a result, these events could significantly influence how consumers shop, and in turn, render the ML model unreliable.
Model Drift in Sales and Marketing
Sales and marketing teams tailor their campaigns and strategies using customer segmentation models. If customer behavior shifts or preferences change, the existing segmentation model may no longer accurately represent the customer base. This can lead to ineffective marketing campaigns and a decline in sales.
What Are the Drawbacks of Model Drift in Machine Learning?
Model drift affects various aspects of model performance and deployment. Besides decreased accuracy, it leads to:
- Poor customer experience
- Compliance risks
- Technical debt
- Flawed decision-making
Model Performance Degradation
When model drift occurs due to changes in consumer behavior, data distribution, and environmental changes, the model's predictions become less accurate, leading to adverse consequences, especially in critical applications such as:
- Healthcare
- Finance
- Self-driving cars
Poor User Experience
Inaccurate predictions can lead to a poor user experience and erode users' trust in the application. This, in turn, may damage the organization's or product's reputation and lead to a loss of customers or business opportunities.
Technical Debt
Model drift introduces technical debt, which accumulates unaddressed issues that make it harder to maintain and improve the model over time. If model drift occurs frequently, data scientists and ML engineers may need to repeatedly retrain or modify the model to maintain its performance, adding to the overall cost and complexity of the system.
Related Reading
How to Detect Machine Learning Model Drift? The Role of Model Monitoring in ML

Early drift detection is crucial for maintaining the accuracy and reliability of machine learning models. As ML models process new input data over time, they can become less accurate if the underlying data distribution shifts significantly. Detecting data drift early on enables teams to retrain or calibrate their models before they produce erroneous predictions, which can negatively impact business operations.
Comparing Predicted Values to Actual Outcomes
The most accurate way to detect model drift is by comparing the predicted values from a given machine learning model to the actual values. The accuracy of a model deteriorates as the predicted values deviate increasingly from the actual values. A standard metric used by data scientists to evaluate the accuracy of a model is the F1 score, primarily because it encompasses both the precision and recall of the model.
Tailoring Metrics to Detect Model Drift
That being said, several metrics are more relevant than others, depending on the situation. For example, type 2 errors would be significant for a cancer-tumor image recognition model. Thus, when a specified metric falls below a given threshold, you’ll know that your model is drifting!
Performance Monitoring and Statistical Tests to Detect Drift
There are two other main ways we can detect drift:
Machine Learning Model-Based Approach
A model-based approach to detect whether the incoming input data has drifted or not.
Statistical Tests
There are many statistical tests to detect data drift. They are primarily divided into three categories:
- Sequential analysis methods
- Custom models to detect drift
- Time distribution methods
Machine Learning Approaches to Detect Drift
This approach uses machine learning models specifically designed to detect changes in the input data over time. These models are trained on historical data to understand the typical patterns and distributions. When new data is received, the model compares it against the learned patterns to identify deviations. For example:
Autoencoders
These are neural networks trained to compress and then reconstruct data. If the reconstruction error (the difference between the original data and its reconstruction) becomes significantly larger, it indicates that the new data differs from the training data, signaling potential drift.
Drift Detection Models
Models like ADWIN (Adaptive Windowing) or DDM (Drift Detection Method) can be employed. These models are designed to work online, continuously monitoring the data stream for changes.
Ensemble Models
Combining multiple models to monitor different aspects of the data can improve detection accuracy. For instance, an ensemble could include models monitoring statistical properties and structural changes in the data.
Statistical Tests to Detect Drift
Statistical tests are commonly used to detect data drift by analyzing the properties of the data distribution. These tests can be categorized into three main groups:
Sequential Analysis Methods
Page-Hinkley Test
The Page-Hinkley method is a statistical technique used to detect changes in the mean of a time series of data. It is commonly used to monitor the performance of machine learning models and detect changes in the data distribution that may indicate model drift.
Defining Thresholds for Page-Hinkley Drift Detection
To use the Page-Hinkley method, the first step is to define a threshold value and a decision function. The threshold value is a value above which a change in the mean is considered significant, and the decision function is a function that returns a value of 1 if a change has been detected and a value of 0 if no change has been detected.
Next, the mean of the data series is calculated at each time step, and the decision function is applied to the data to determine if a change has occurred. If the decision function returns a value of 1, it indicates that a change has been detected and the model may be drifting.
The Page-Hinkley method is a straightforward and effective approach for detecting changes in the mean of a data series over time. It is beneficial for detecting small changes in the mean that may not be immediately apparent when looking at the data.
Nevertheless, it is crucial to carefully select the threshold value and decision function to ensure that the method is sensitive enough to detect changes in the data without generating false alarms.
CUSUM (Cumulative Sum Control Chart
This method detects shifts in the mean value of a monitored process over time. It is effective for identifying small and consistent changes in the data.
Custom Models to Detect Drift
KL Divergence
Kullback-Leibler divergence measures the difference between two probability distributions. It can be used to compare new data distribution with the training data.
Chi-Square Test
This test compares the observed frequencies of data with the expected frequencies. It is helpful for categorical data to detect changes in distribution.
Jensen-Shannon Divergence (JSD)
Jensen-Shannon Divergence measures the similarity between two probability distributions. It is suitable in cases where the underlying data distributions are not easily compared using traditional statistical tests, such as when the distributions are:
- Multimodal
- Complex
- Have different shapes
It is less sensitive to outliers than KL Divergence, making it a robust choice for noisy data.
Population Stability Index
The Population Stability Index (PSI) is a statistical measure used to compare the distribution of a categorical variable across two different datasets. The Population Stability Index (PSI) is a tool used to measure the degree of change in the distribution of a variable between two samples or over time.
It is commonly used to monitor changes in the characteristics of a population and to identify potential problems with the performance of a machine learning model.
Unveiling Distributional Shifts
A high PSI value indicates a significant difference between the distributions of the variable in the two datasets, which may suggest model drift. If the distribution of a variable has changed significantly, or if several variables have changed to some extent, it may be necessary to recalibrate or rebuild the model to improve its performance.
Time Distribution Methods
Kolmogorov-Smirnov (KS) Test
The Kolmogorov-Smirnov (K-S) test is a non-parametric statistical test used to determine whether two sets of data come from the same distribution. It is often used to test whether a sample of data comes from a specific population or to compare two samples to determine if they come from the same population.The null hypothesis in this test is that the distributions are the same. If this hypothesis is rejected, it suggests that there is a drift in the model. The K-S test is a valuable tool for comparing datasets and determining whether they come from the same distribution.
Mann-Whitney U Test
This test compares the ranks of two independent samples to determine if they come from the same distribution. It is suitable for detecting drift in non-parametric data.
T-Test
This test compares the means of two groups to determine if there are significant differences. It helps detect drift in normally distributed data. These approaches and tests provide a comprehensive toolkit for detecting data drift, each of which is suitable for different data and drift patterns. By combining these methods, organizations can ensure their machine-learning models remain accurate and reliable.
Related Reading
Best Practices for Improving Model Performance and Reducing Model Drift

Every machine learning model requires specific evaluation and monitoring metrics to accurately reflect its performance. Establishing an appropriate baseline performance is crucial for accurately comparing metric values. The selected metrics should align with the specific objectives and features of the model.
For example, classification models are best evaluated using accuracy, precision, and recall metrics, which measure how well the model differentiates between different classes. Regression models are assessed using metrics like:
- Mean absolute error
- Mean squared error
- Root mean squared error
- R-squared
Evaluating Model Performance with Prediction-Actuality Metrics
This focuses on the difference between predicted and actual values. Natural language processing models utilize metrics such as BLEU, ROUGE, and perplexity to evaluate the quality and relevance of generated text against reference texts. When selecting your metric, understand its underlying principles and limitations.
For instance, a model trained on imbalanced data may exhibit high accuracy values but fail to account for less frequent events. In such cases, metrics like the F1 score or the AUC-ROC curve would provide a more comprehensive assessment.
Keep an Eye on Your Metrics
Regularly tracking your machine learning model’s performance metrics, such as accuracy, precision, recall, F1 score, and AUC-ROC curve, is crucial for spotting deviations from expected performance. This can be accomplished with automated monitoring tools or by manually reviewing model predictions and performance reports. Monitoring these metrics helps ensure that your model remains accurate and reliable over time.
Analyzing Data Distribution
Constantly monitoring the data distribution of input features and target variables over time helps detect any shifts or changes that may indicate model drift. This can be done using statistical tests, anomaly detection algorithms, or data visualization techniques.
Setting Up Data Quality Checks
Accurate data is necessary for good and reliable model performance. Implementing robust data quality checks helps identify and address errors, inconsistencies, or missing values in the data that could impact the model’s training and predictions. You can use data visualization techniques and interactive dashboards to track these changes in data quality over time.
Leverage Automated Monitoring Tools
Automated monitoring tools offer a more streamlined approach to tracking model performance and data quality throughout the machine learning lifecycle. They provide real-time alerts, historical tracking with observability, and logging features to facilitate proactive monitoring and intervention. Automated tools also reduce the team’s overhead costs.
Continuous Retraining and Model Versioning
Periodically retraining machine learning models with updated data helps teams adapt to changes in data distribution and maintain optimal performance. Retraining can be done manually or automated using MLOps deployment techniques as soon as training is complete. These include:
- Continuous monitoring
- Continuous training
- Continuous deployment
Model versioning enables the tracking of different model versions' performance and comparison of their effectiveness. This enables data scientists to identify the best-performing model and revert to previous versions if necessary.
Human-in-the-Loop Monitoring
It is crucial to have an iterative review and feedback process conducted by expert human annotators and data scientists. This process can validate the detected model drifts and decide whether they are significant or temporary anomalies. Human-in-the-loop monitoring also helps determine when and how to retrain the model when model drift is detected.
MLOps
MLOps is a set of practices that can be used to create sustainable machine learning models. This includes automating the building, testing, and deployment of models, as well as monitoring and managing their performance over time. By using MLOps, it’s possible to detect and prevent model drift early and resolve issues before the model degrades significantly.
Start Building with $10 in Free API Credits Today!
Inference delivers OpenAI-compatible serverless inference APIs for top open-source LLM models, offering developers the highest performance at the lowest cost in the market. Beyond standard inference, Inference provides specialized batch processing for large-scale async AI workloads and document extraction capabilities designed explicitly for RAG applications.
Start building with $10 in free API credits and experience state-of-the-art language models that balance cost-efficiency with high performance.
Related Reading
Meet with our research team
Schedule a call with our research team to learn more about how Specialized Language Models can cut costs and improve performance.